- Published on
MLOps Basics [Week 9]: Prediction Monitoring - Kibana
- Authors

- Name
- Raviraja Ganta
- @raviraja_ganta


What is the need of monitoring?
Monitoring systems can help give us confidence that our systems are running smoothly and, in the event of a system failure, can quickly provide appropriate context when diagnosing the root cause.
Things we want to monitor during and training and inference are different. During training we are concered about whether the loss is decreasing or not, whether the model is overfitting, etc.
But, during inference, We like to have confidence that our model is making correct predictions.
There are many reasons why a model can fail to make useful predictions:
The underlying data distribution has shifted over time and the model has gone stale. i.e inference data characteristics is different from the data characteristics used to train the model.
The inference data stream contains edge cases (not seen during model training). In this scenarios model might perform poorly or can lead to errors.
The model was misconfigured in its production deployment. (Configuration issues are common)
In all of these scenarios, the model could still make a successful prediction from a service perspective, but the predictions will likely not be useful. Monitoring machine learning models can help us detect such scenarios and intervene (e.g. trigger a model retraining/deployment pipeline).
The scope of this post to understand the basics of monitoring predictions.
There are different tools available for monitoring:
and many more...
I will be using Kibana.
In this post, I will be going through the following topics:
Basics of Cloudwatch LogsCreating Elastic Search ClusterConfiguring Cloudwatch Logs with Elastic SearchCreating Index Patterns in KibanaCreating Kibana VisualisationsCreating Kibana Dashboard
Basics of Cloudwatch Logs
What is Cloudwatch logs?
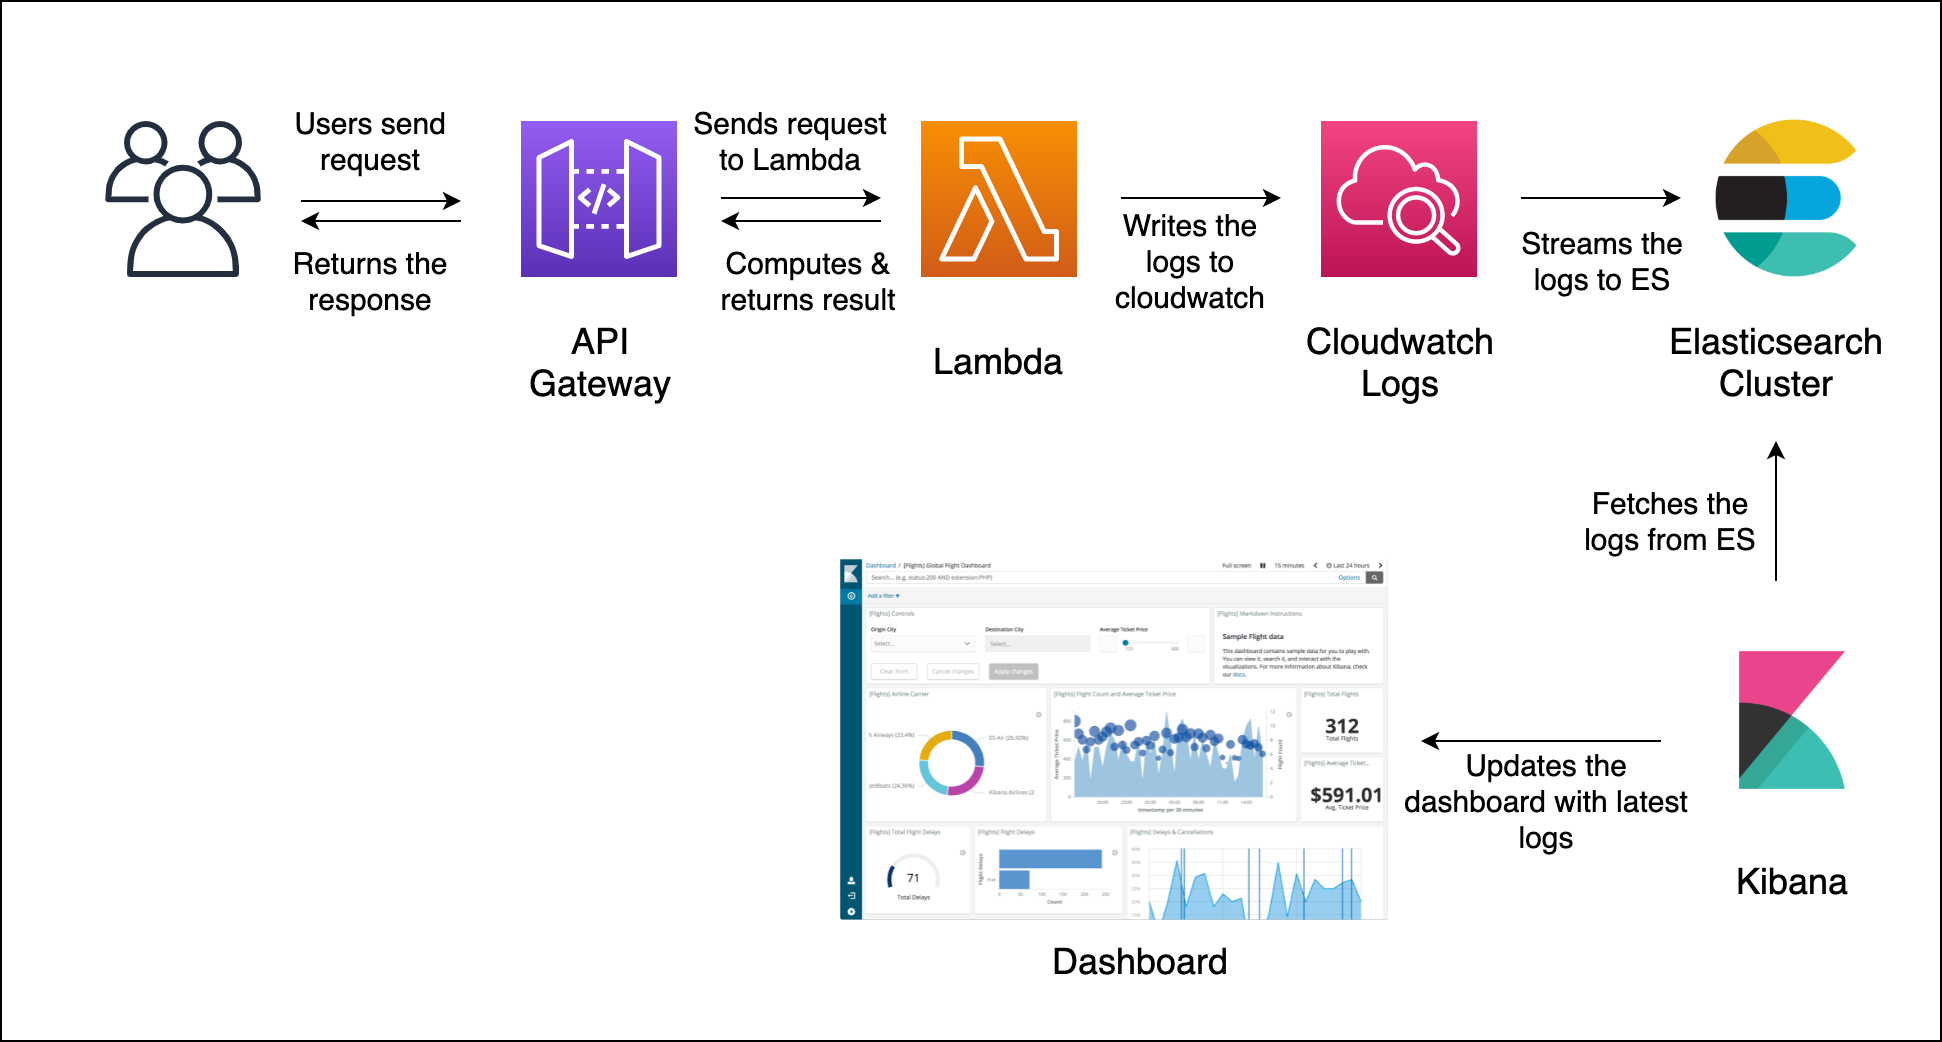
Amazon CloudWatch Logs is a service that collects and stores logs from your application and infrastructure running on AWS, provides the same features expected of any log management tool: real-time monitoring, searching and filtering, and alerts.
Let's see how to check the logs for the lambda we implemented in the last week.
- Go to the
MLOps-BasicsLambda. Navigate to theMonitorsection andLogspart. There will be a button indicatingView logs in cloudwatch. Click on that.

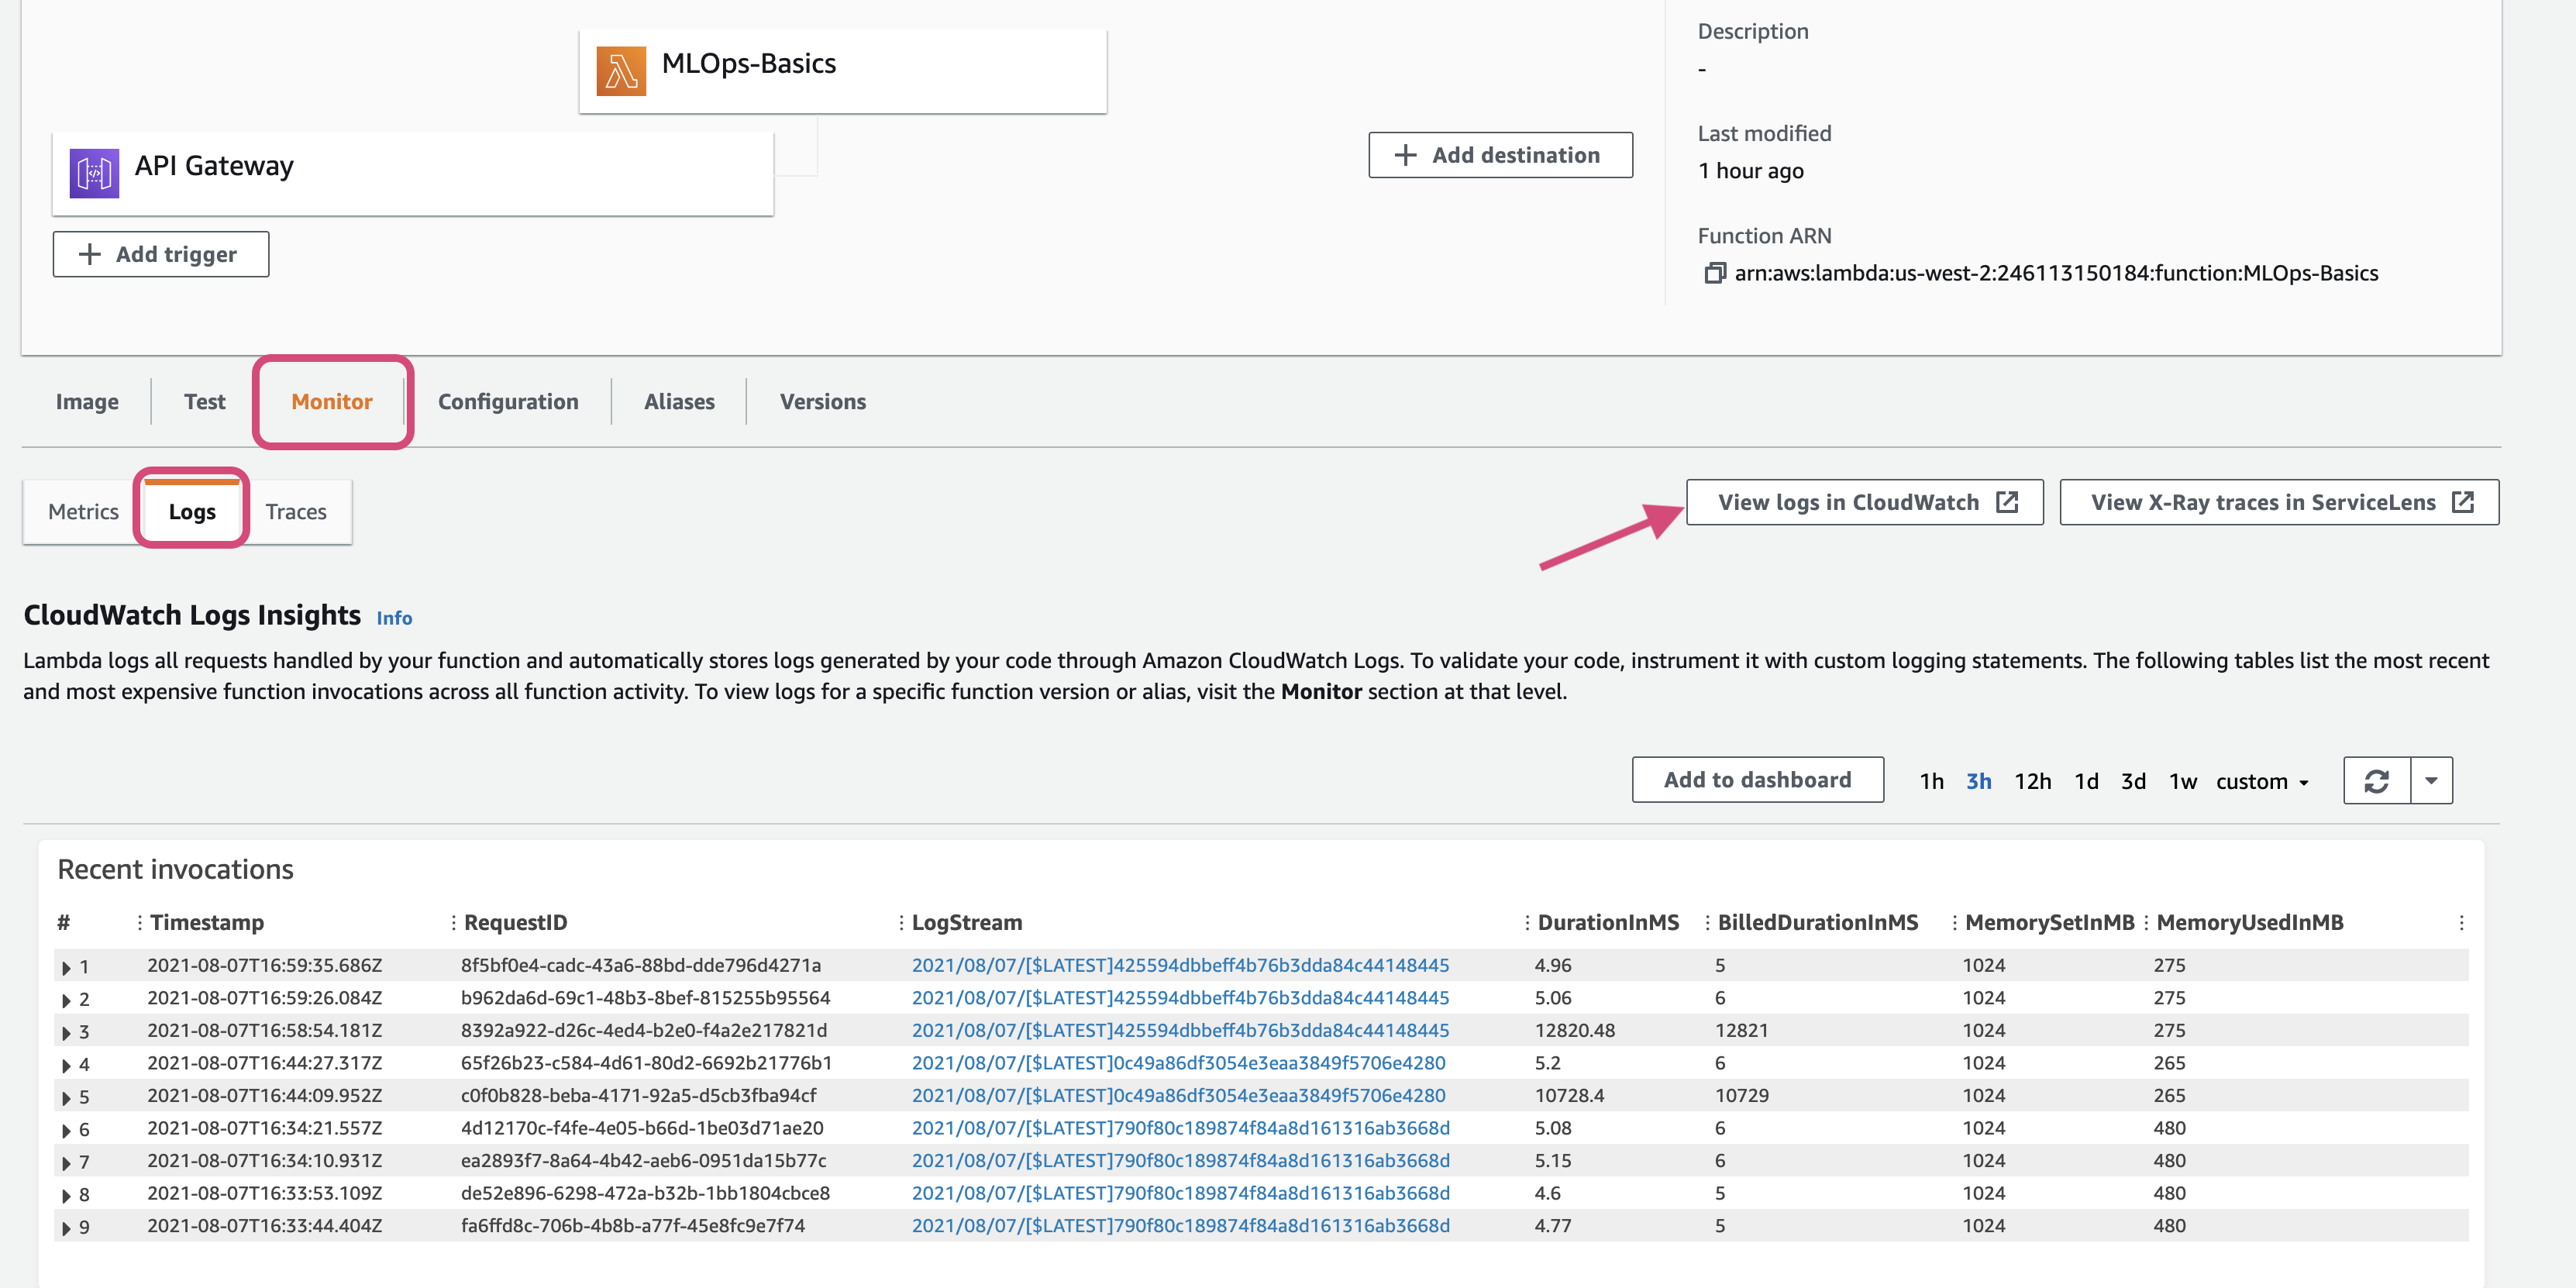
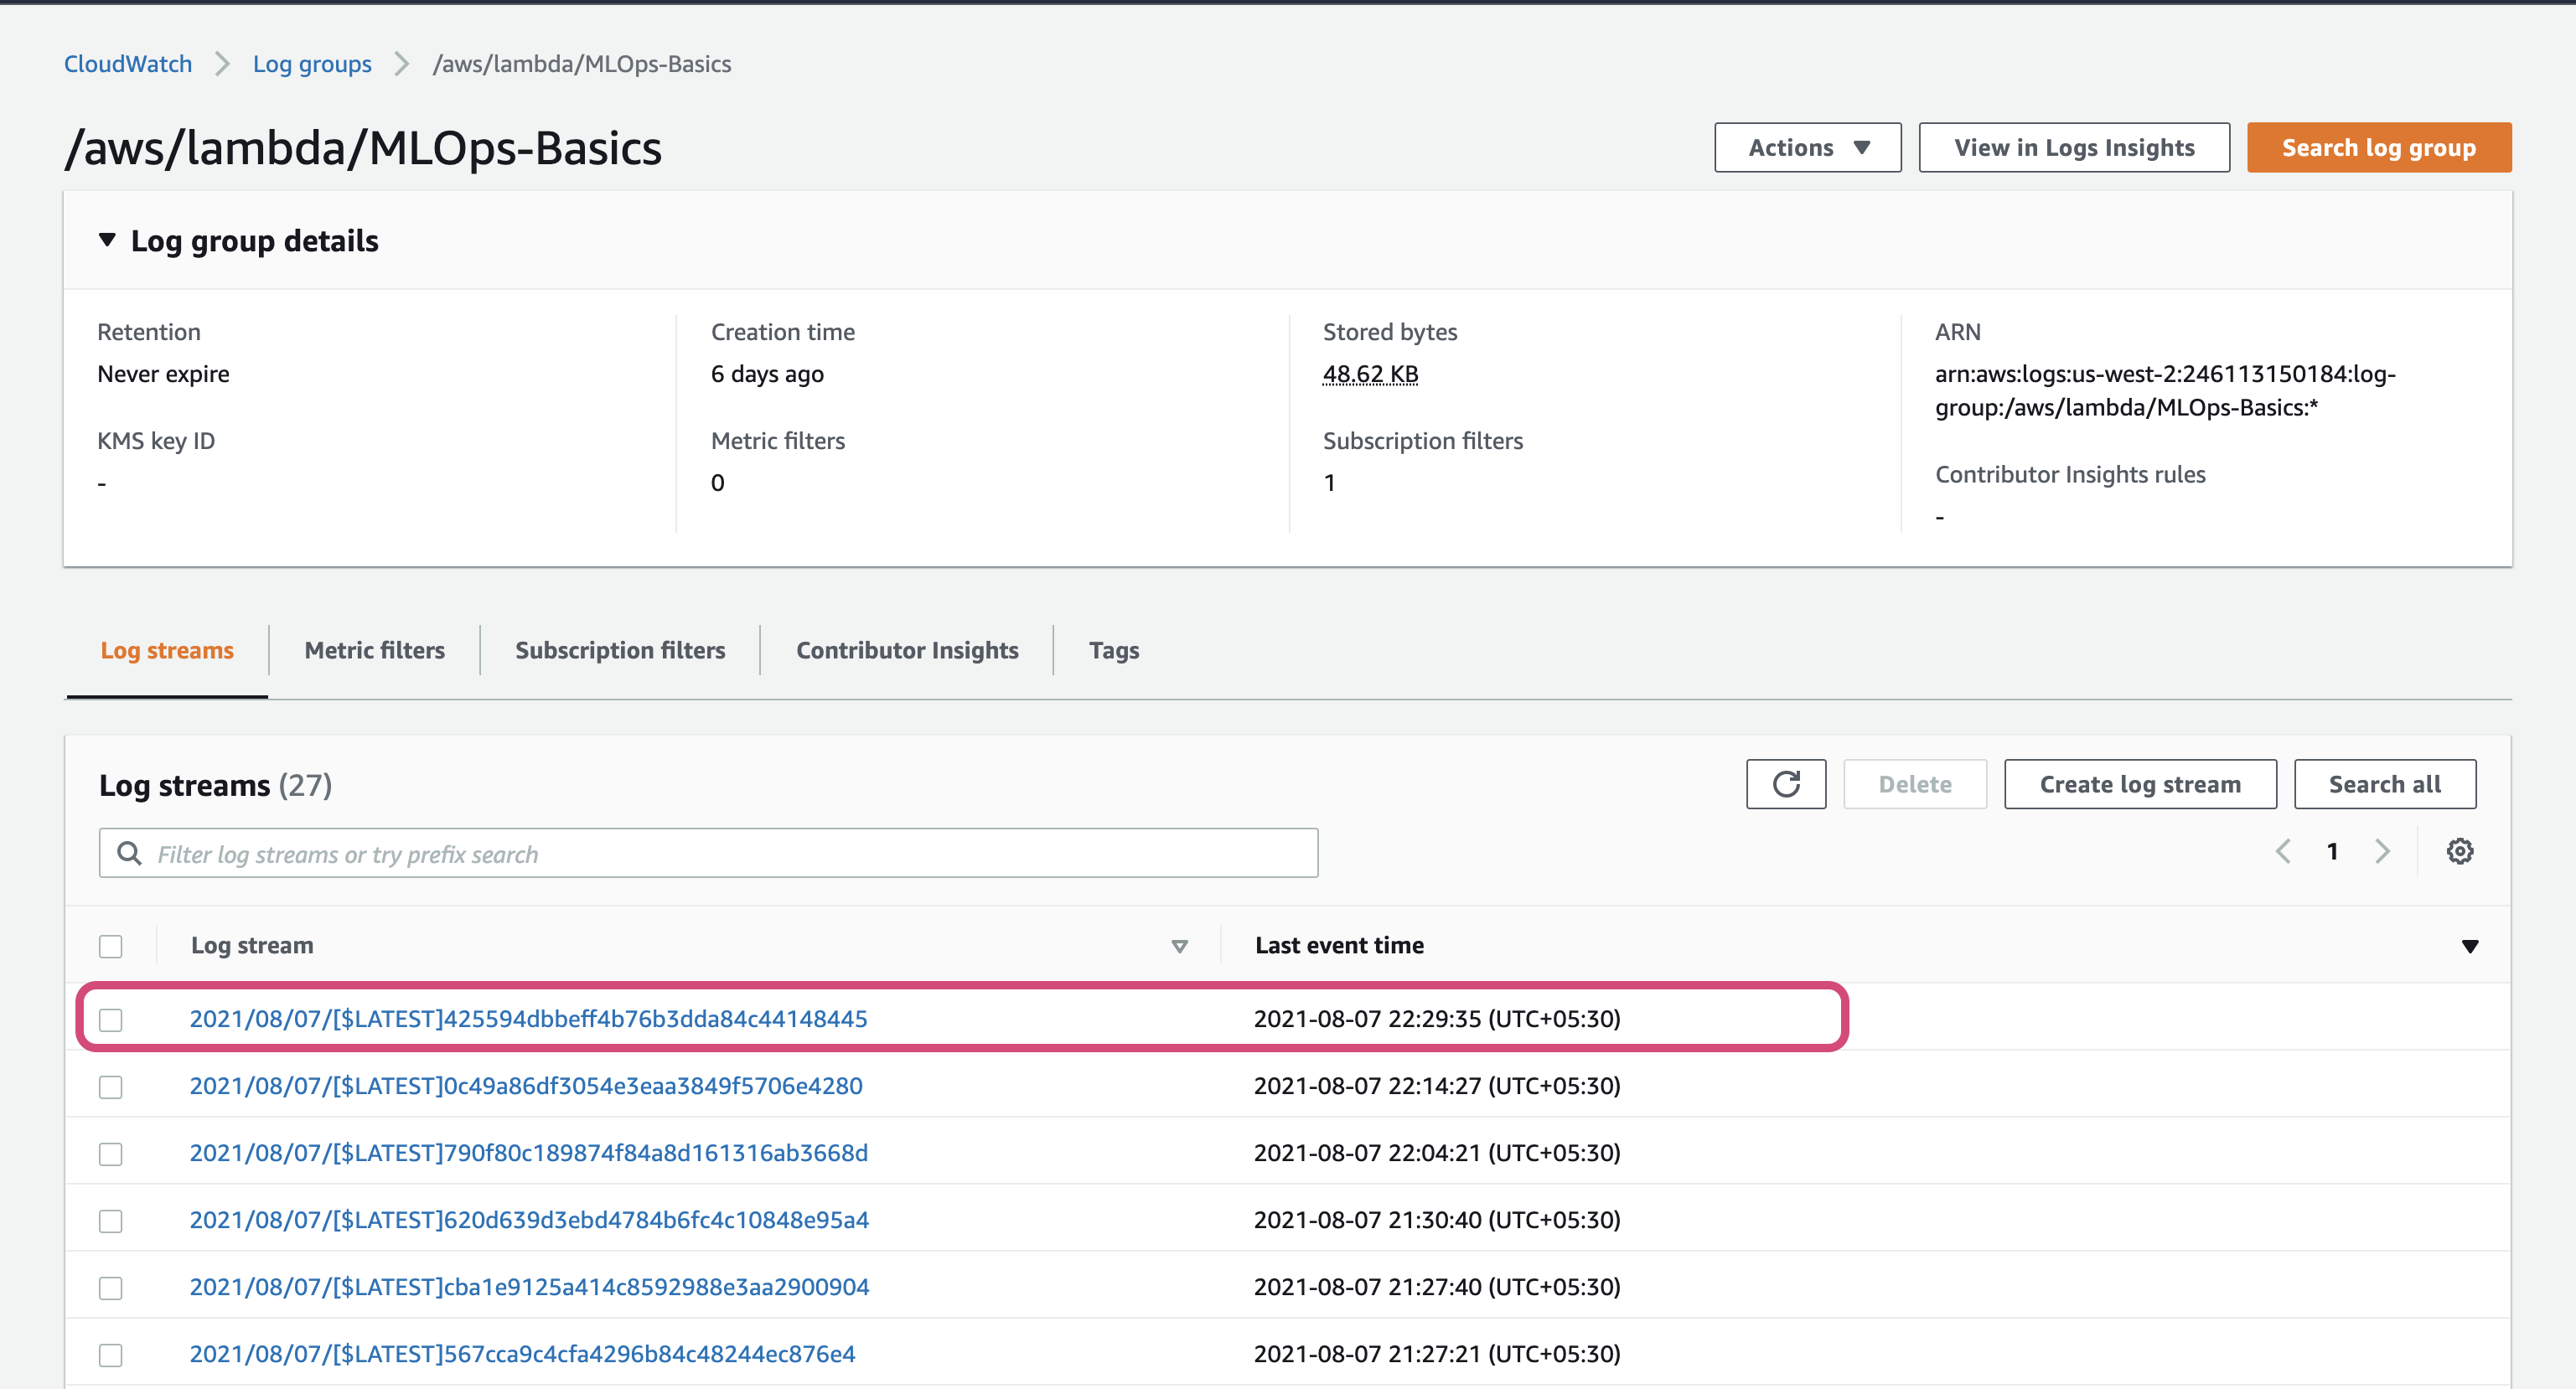
- Now a new window will open (Cloudwatch) which contains the logs of the Lambda. This is the
Log groupcorresponding to the lambda. Click on the top one.

- The logs corresponding to the latest stream will be visible as follows.

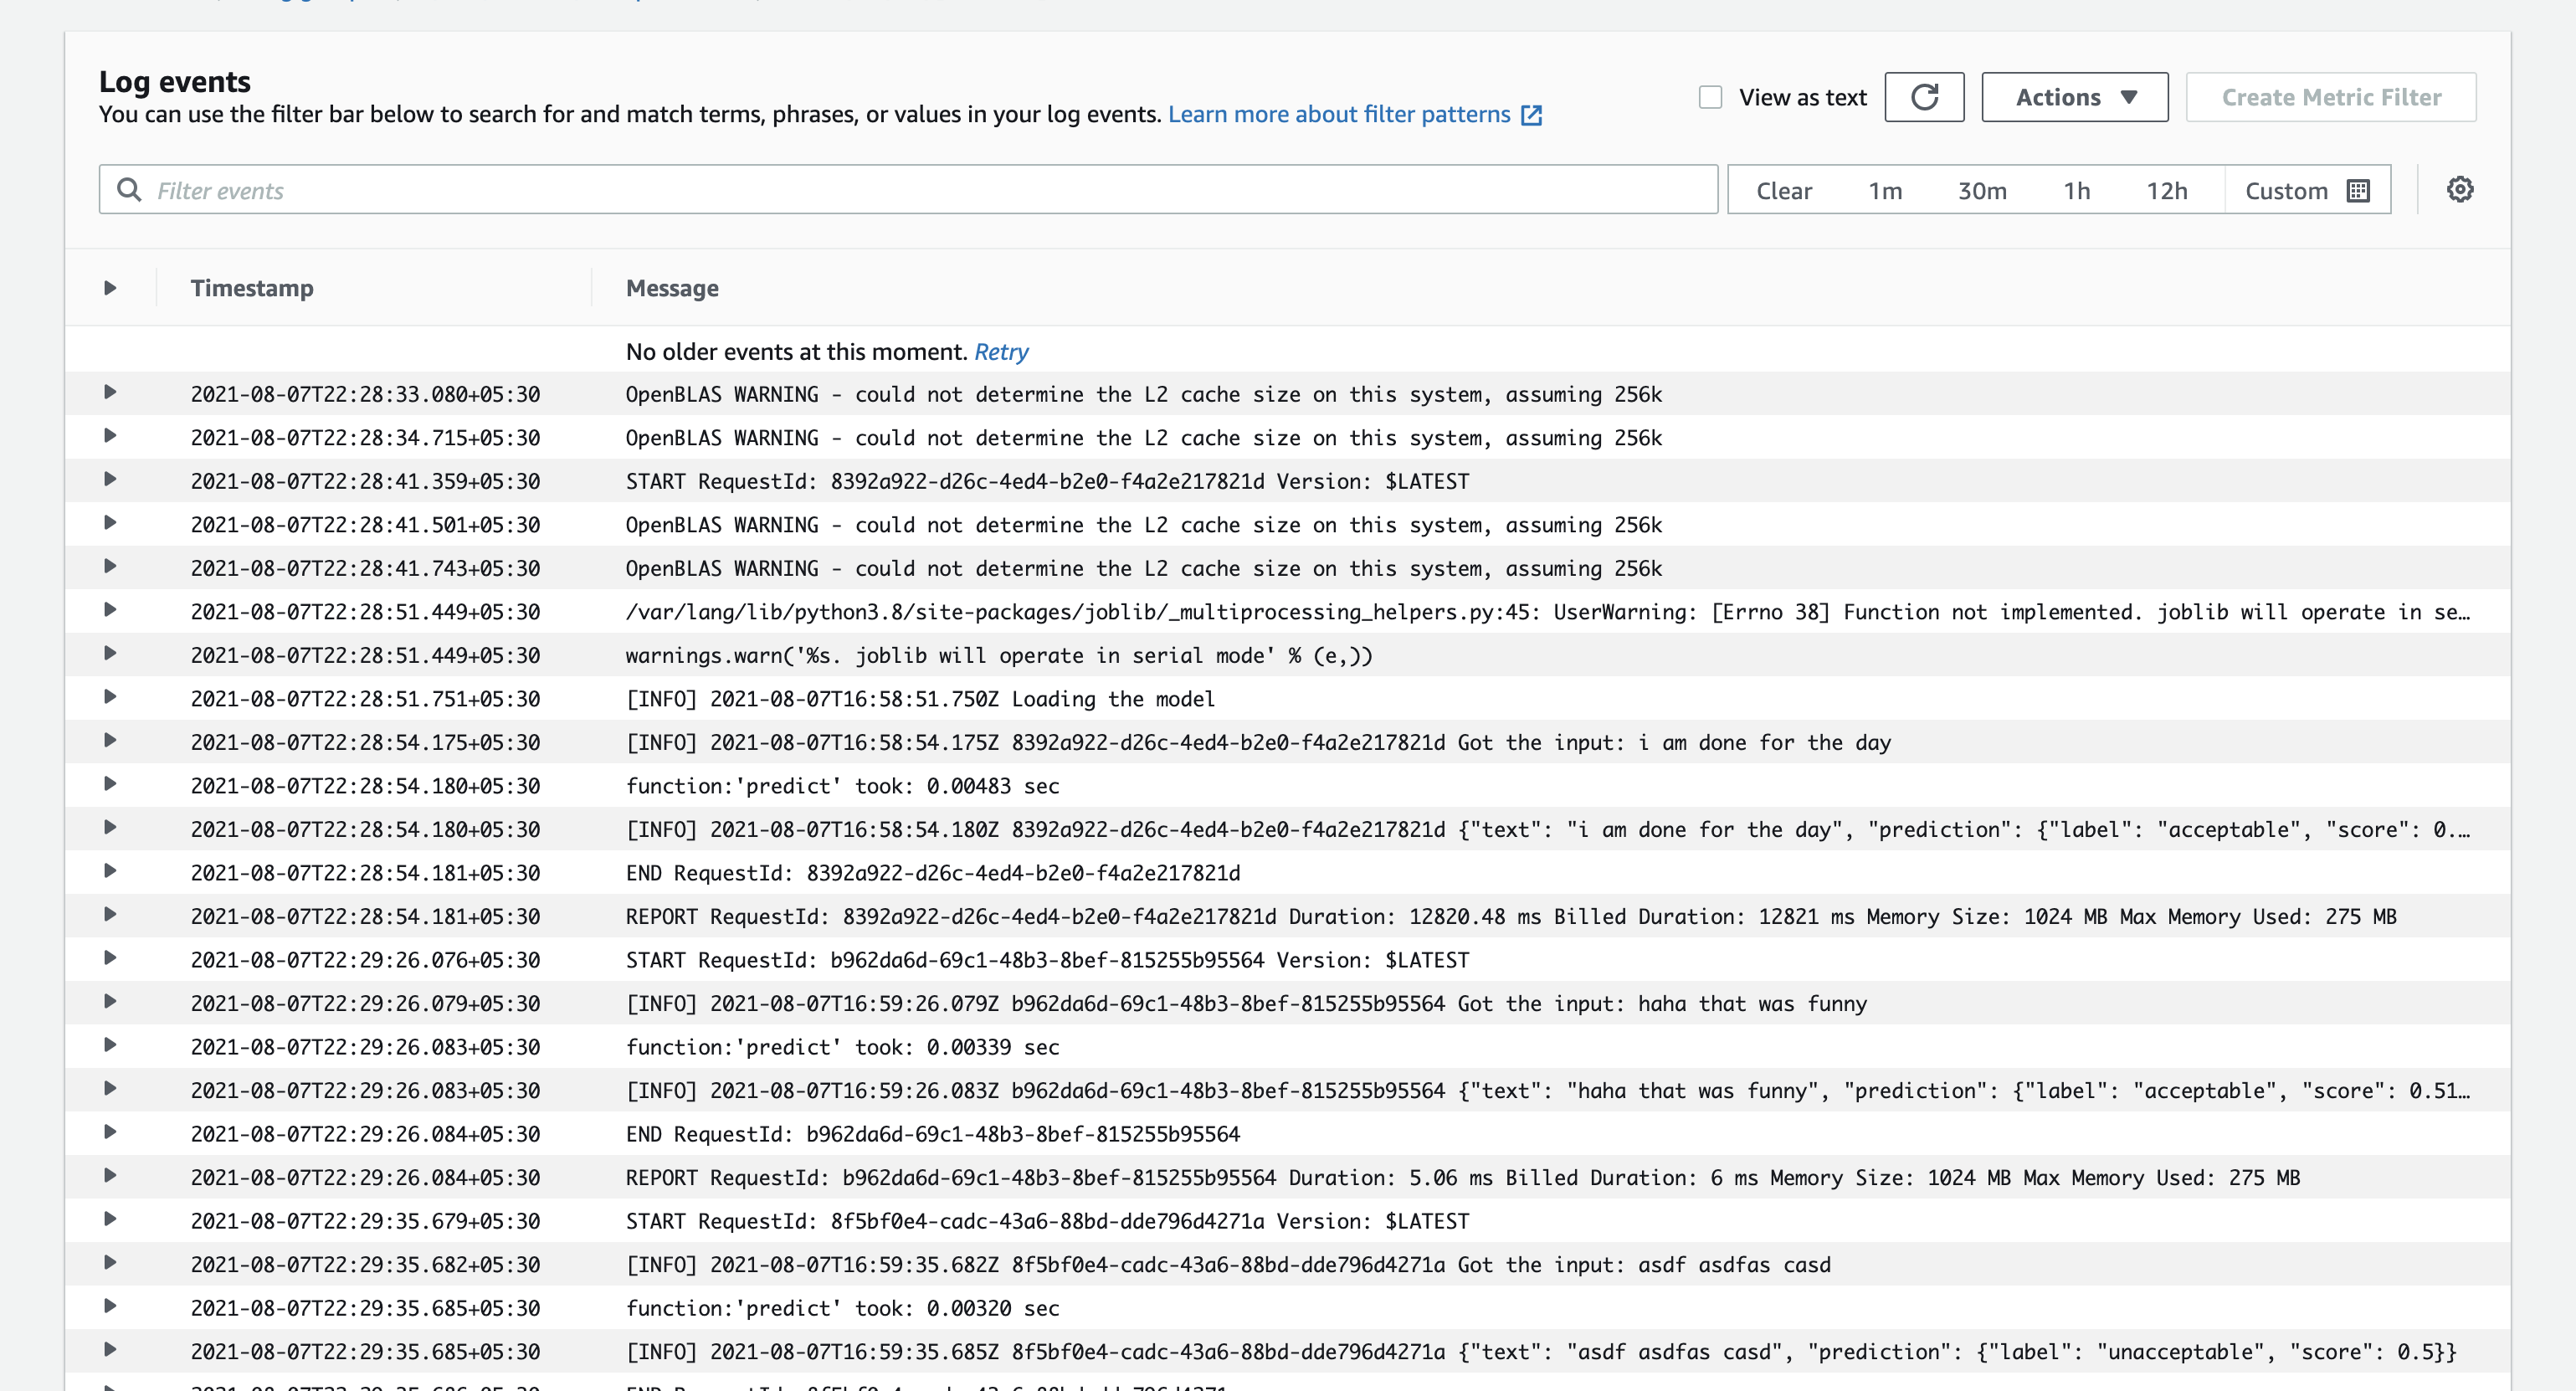
It will be hard to monitor the predictions using these logs. Having a dashboard containing the predictions and counts will be helpful to monitor. Let's see how to stream these logs to Kibana and visualise there.
Creating Elastic Search Cluster
Let's create an Elastic Search Cluster which will be used to stream the logs.
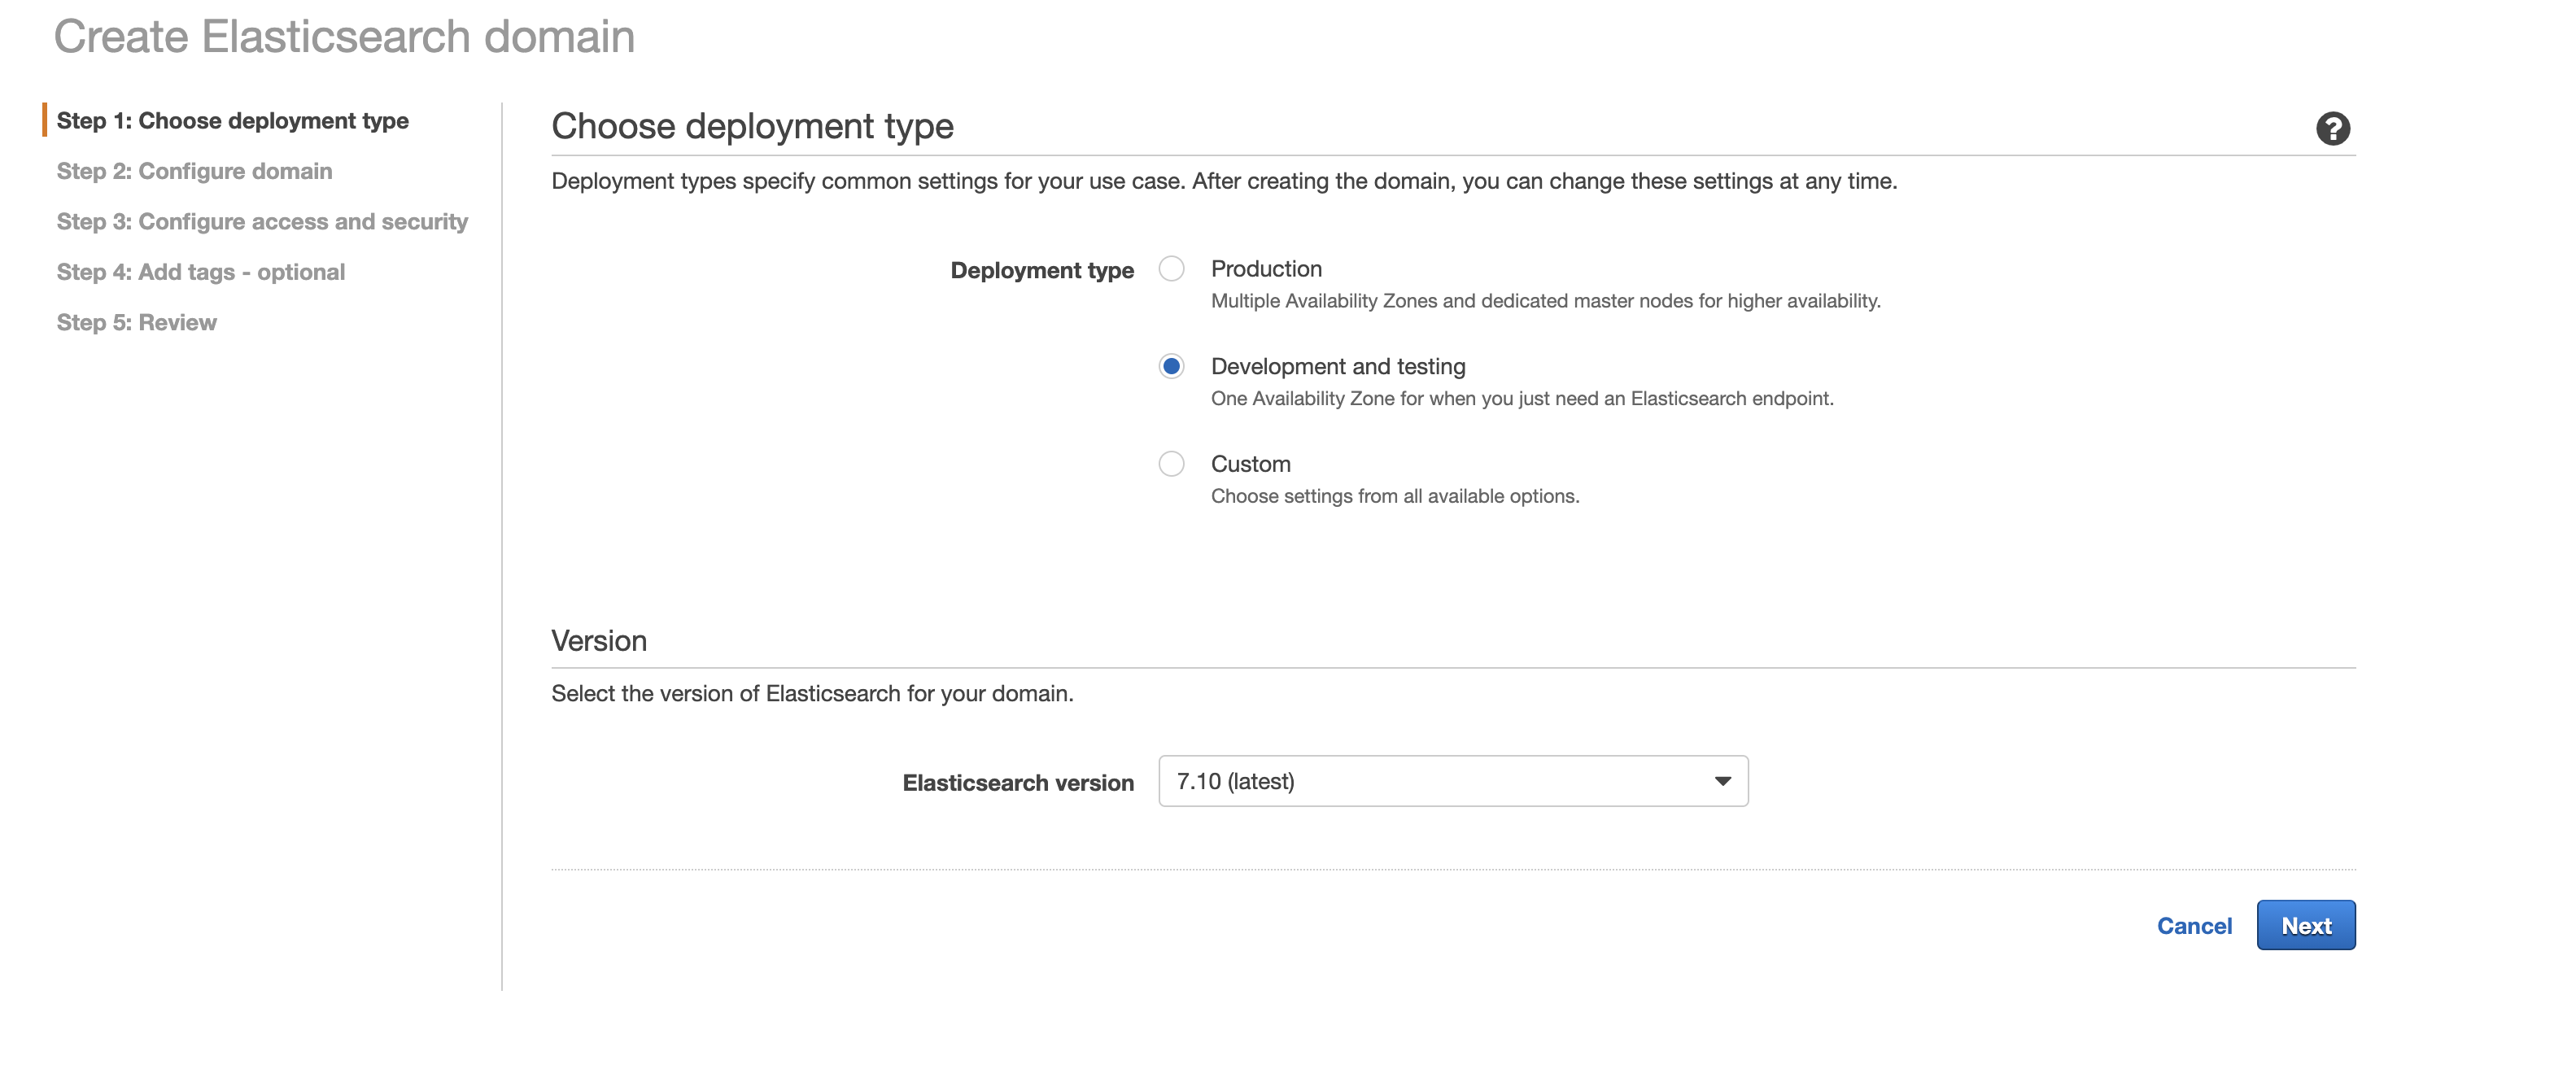
Sign in to the AWS Management Console and open the Elasticsearch Service at https://console.aws.amazon.com/es/home. Create a
New DomainChoose the domain type as
Development and Testing(change according to the needs)

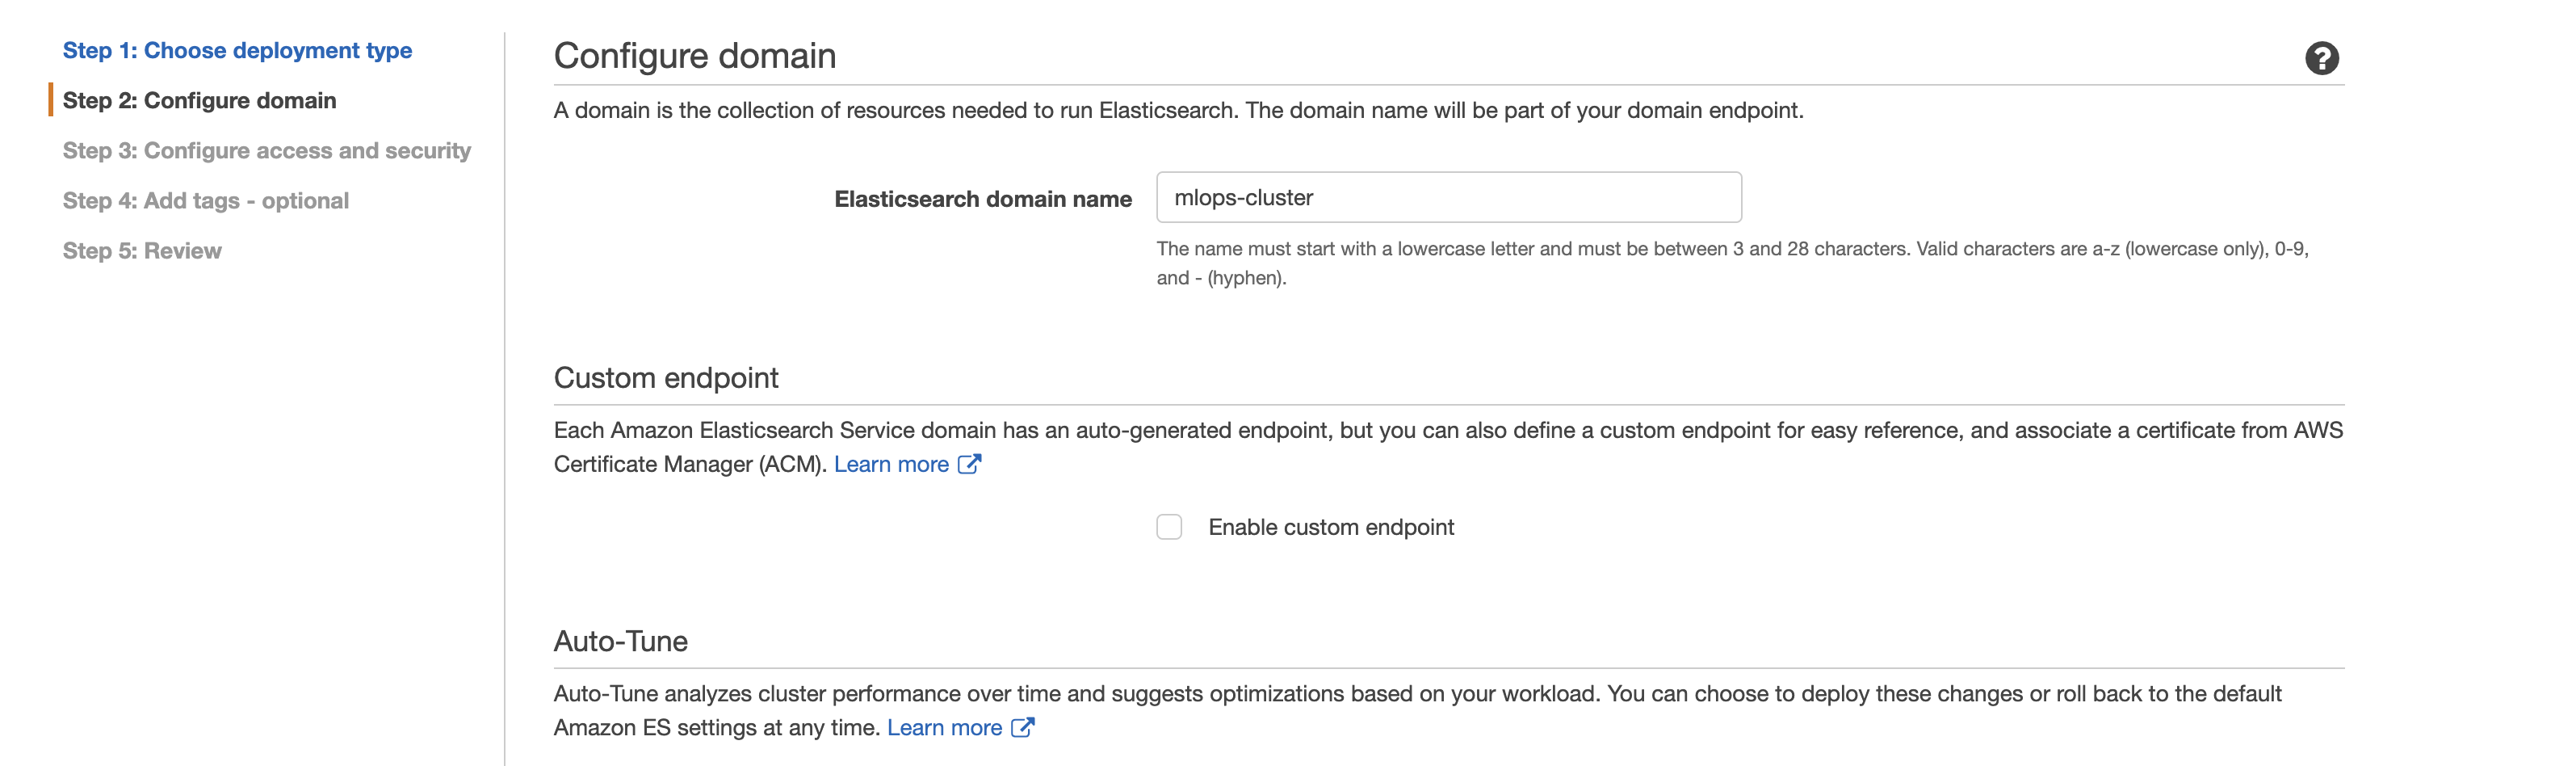
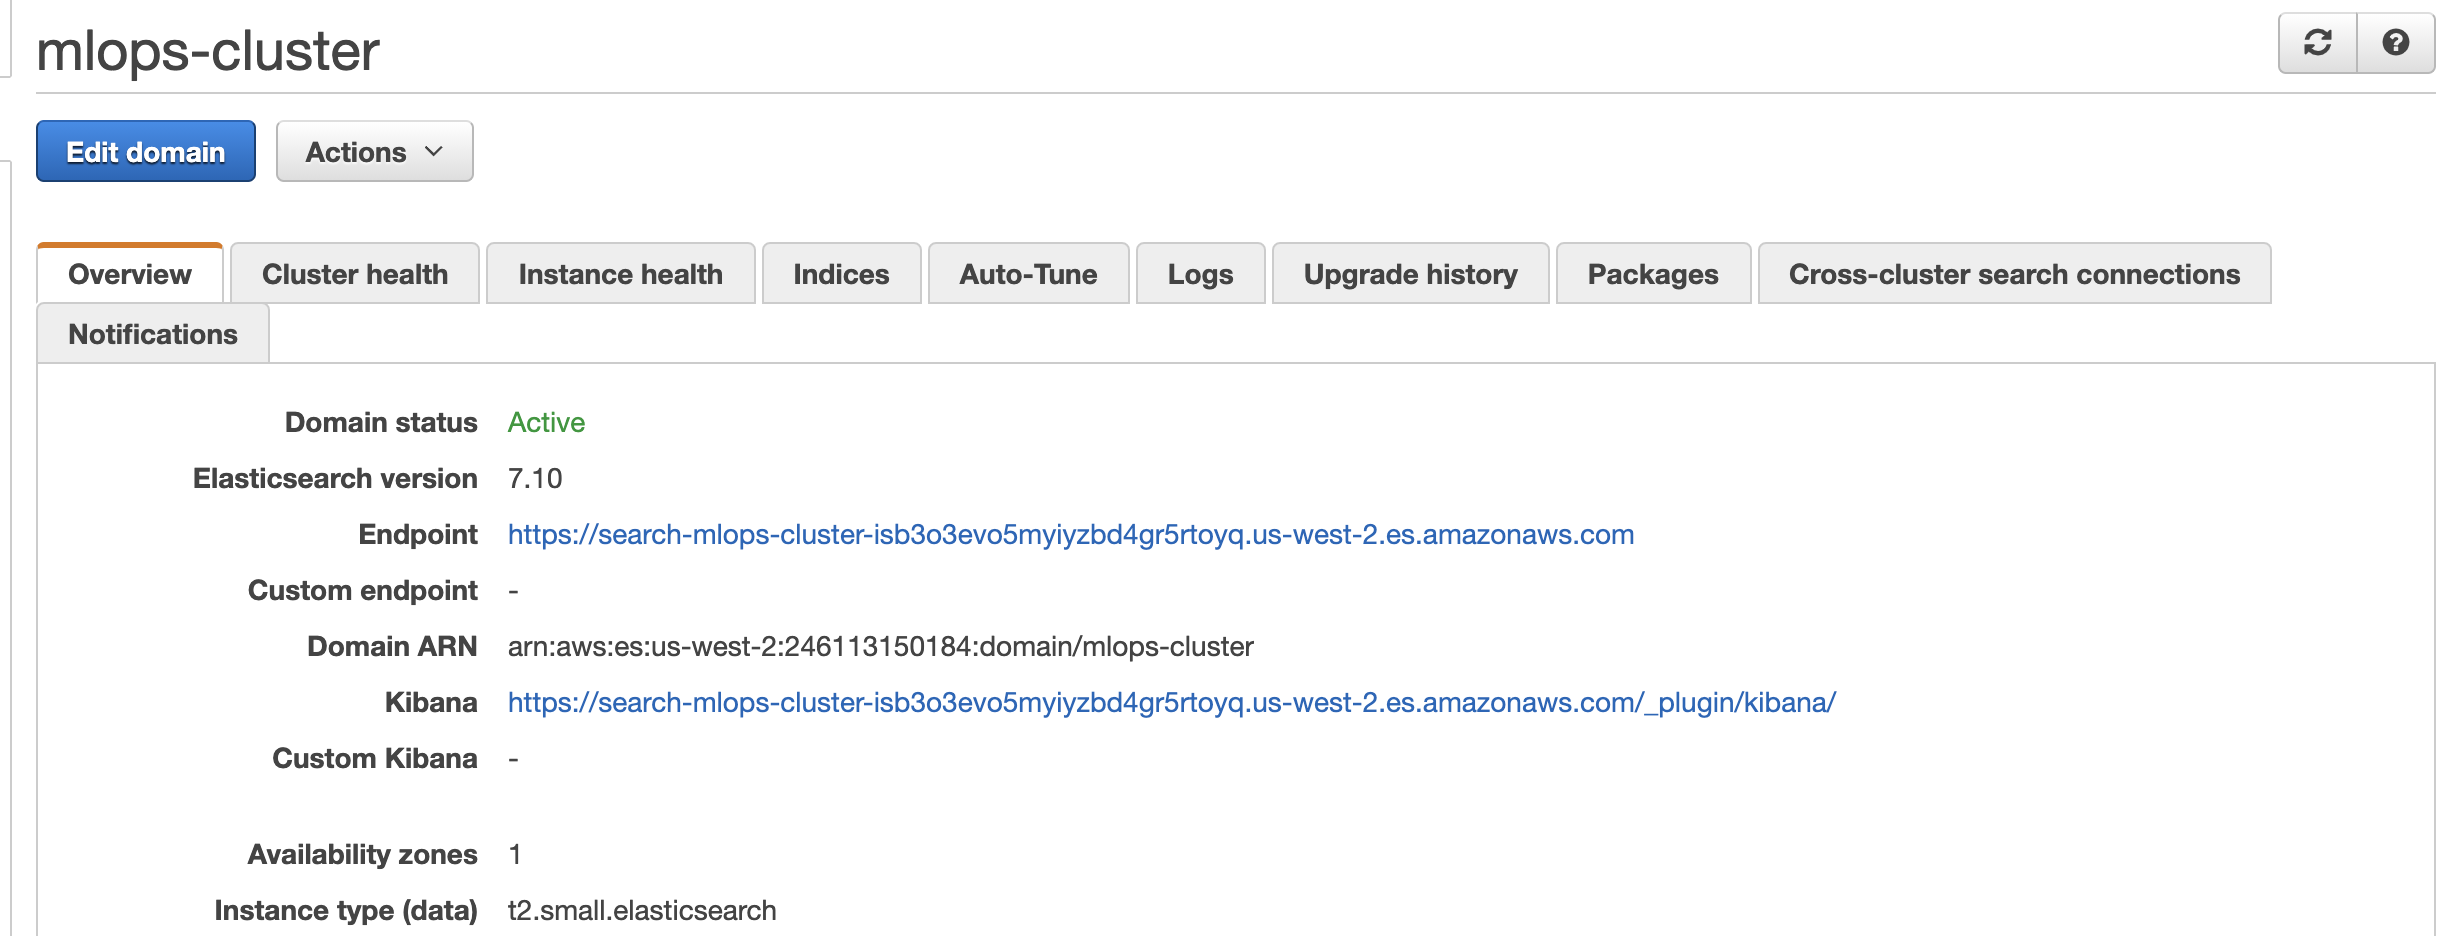
- Give the domain a name.
mlops-cluster

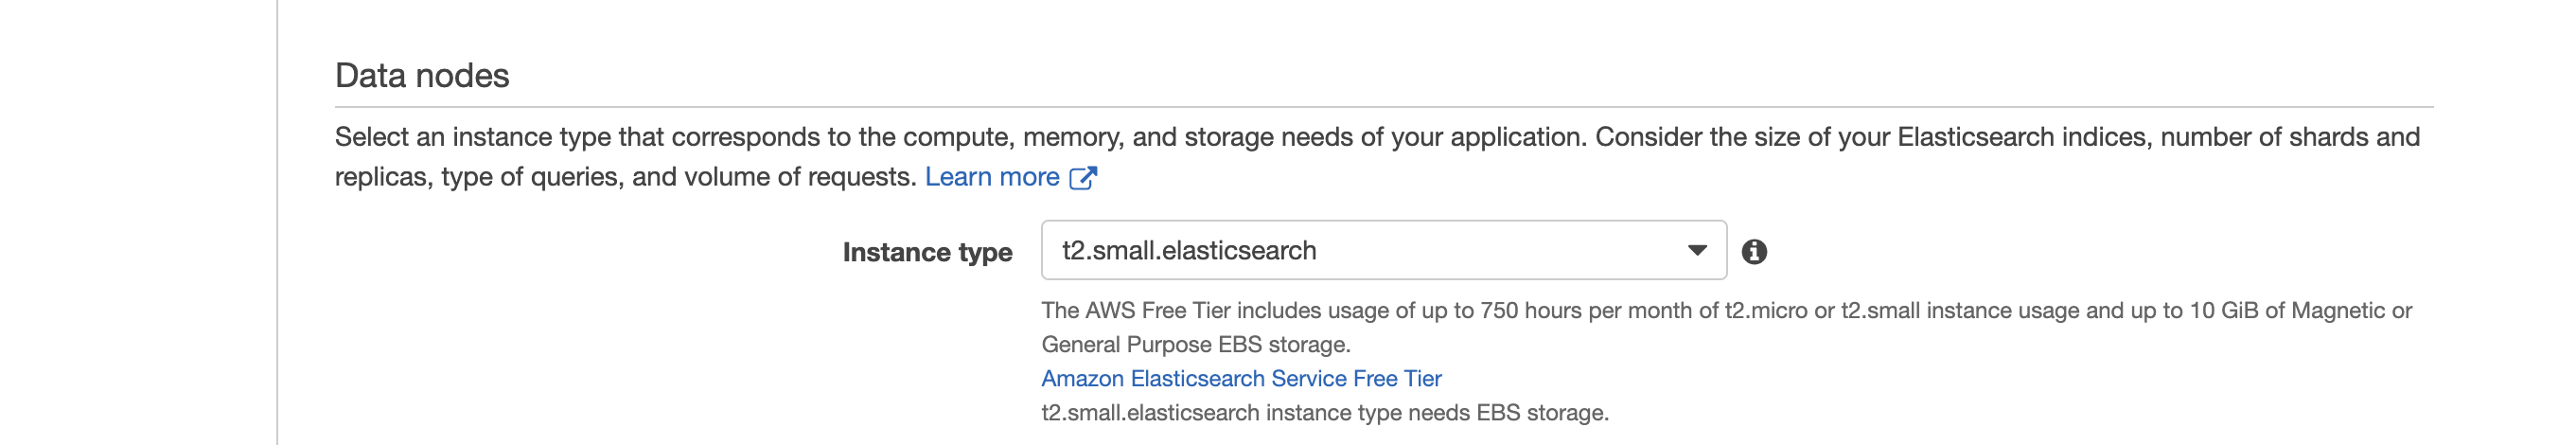
- Choosing the instance type as
t2.small.elasticsearch(since this is for demo).

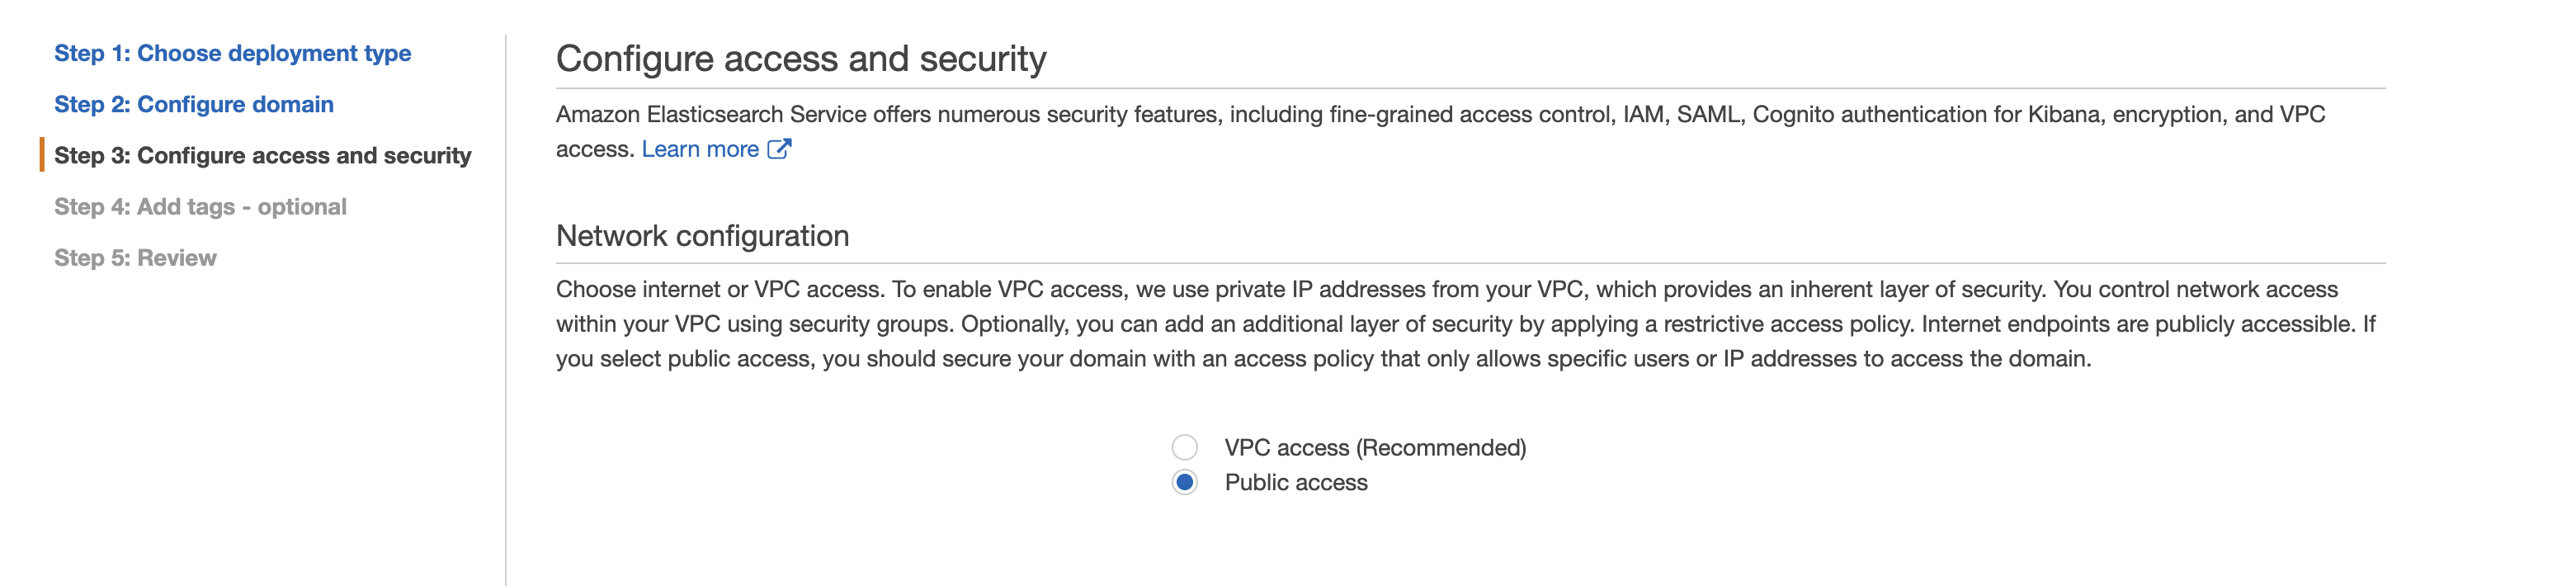
- Choosing the Network configuration as
Public accessso that it can be shared across different people easily. (With VPC also it can be shared but it requires some more configuration.)

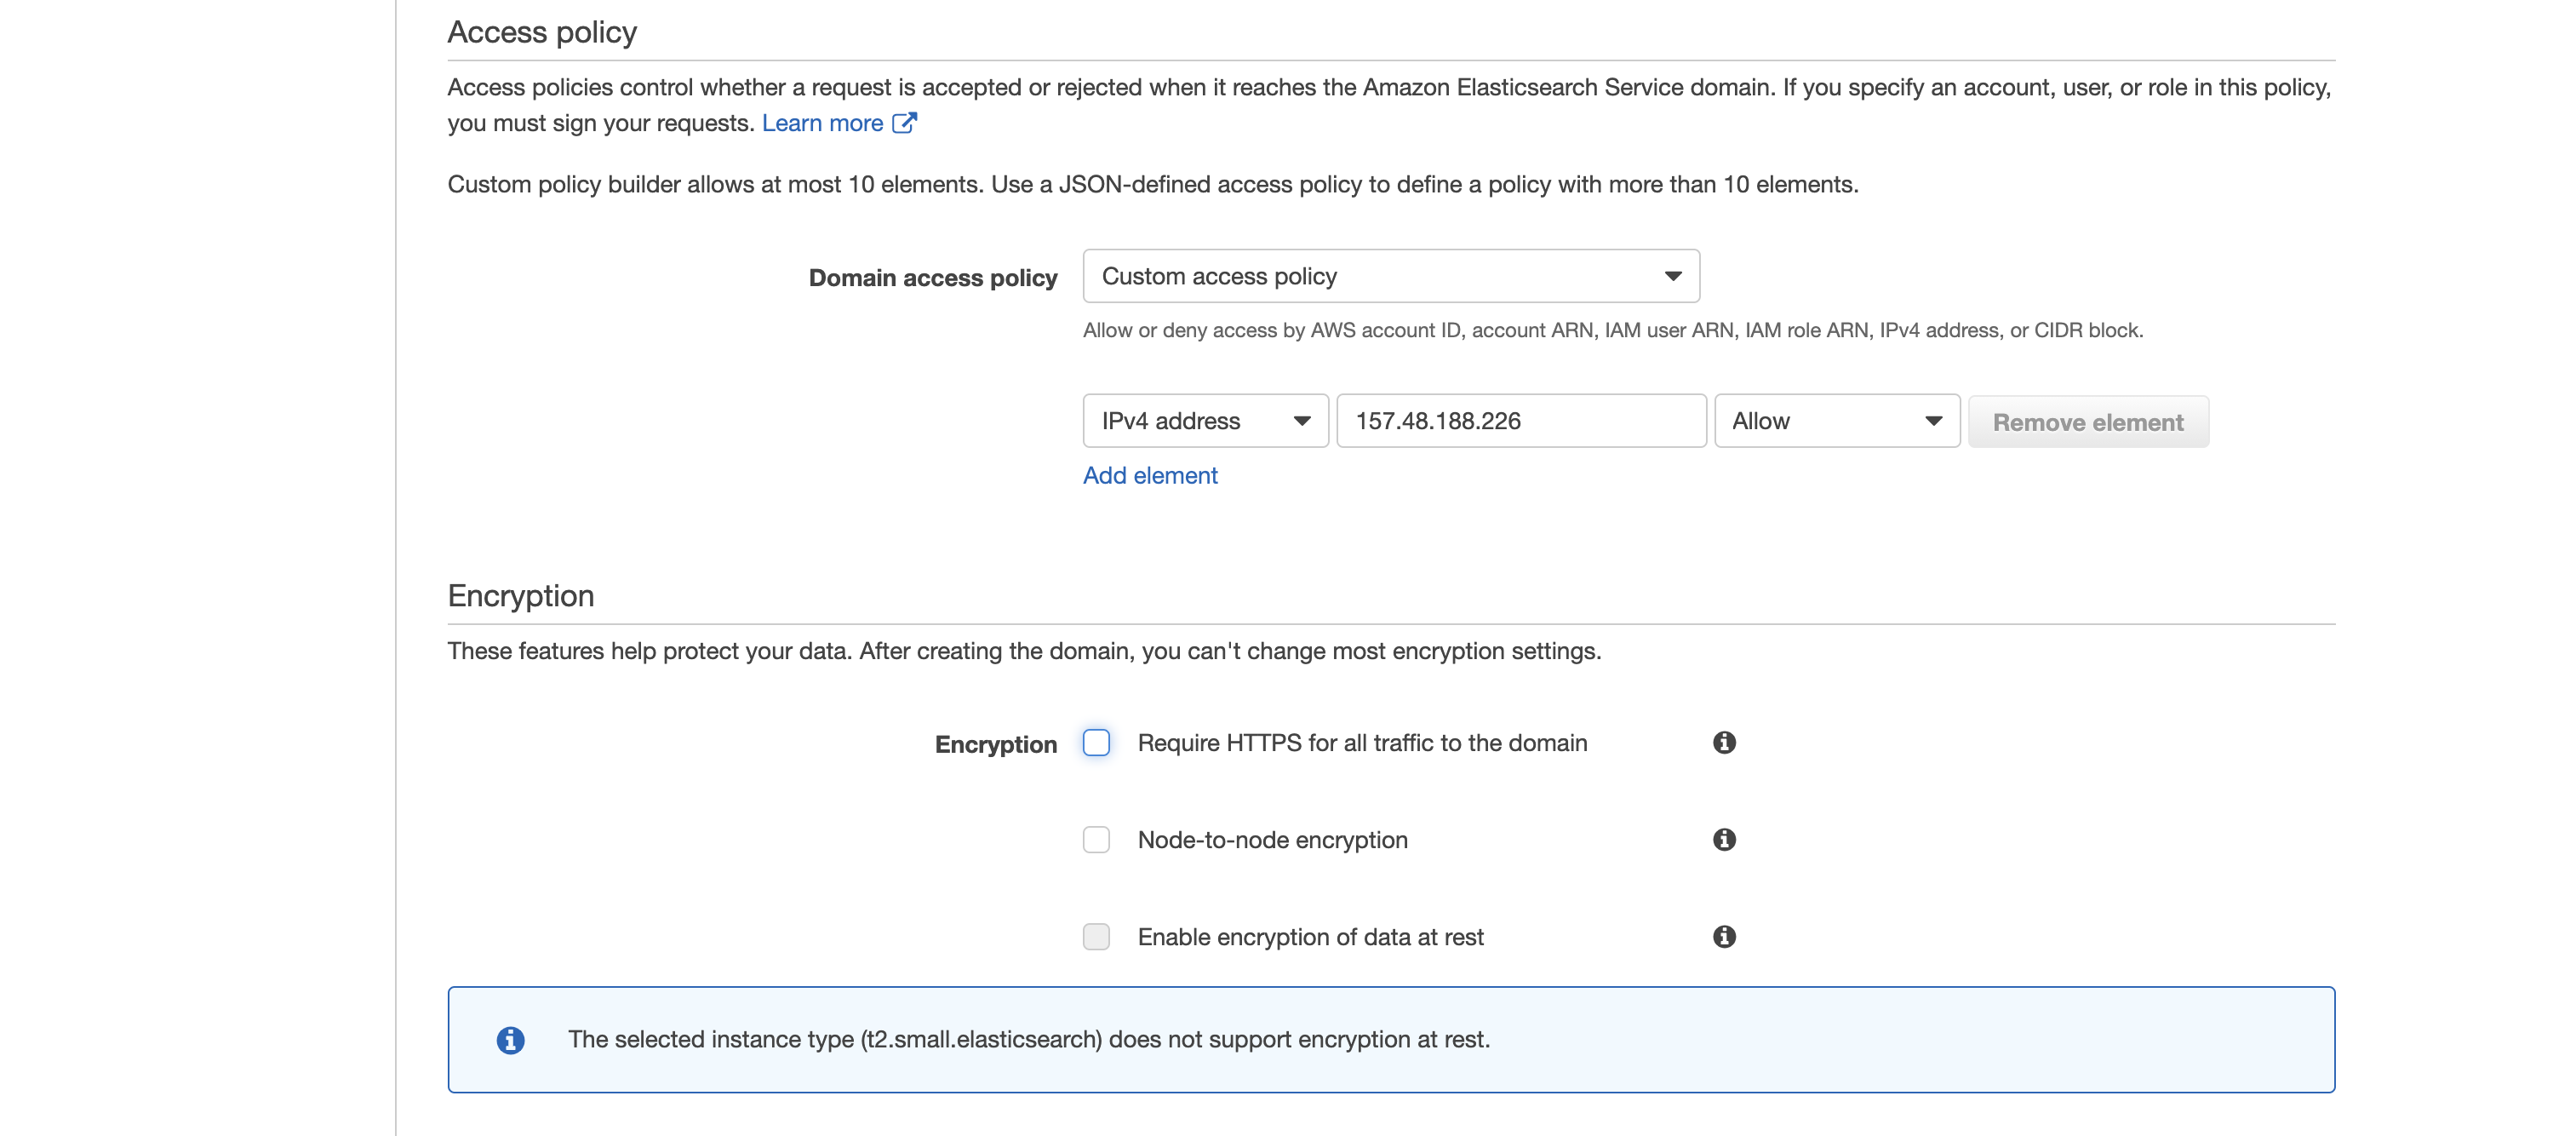
- Get the ip of the machine using this link and then add that in the domain access policy.

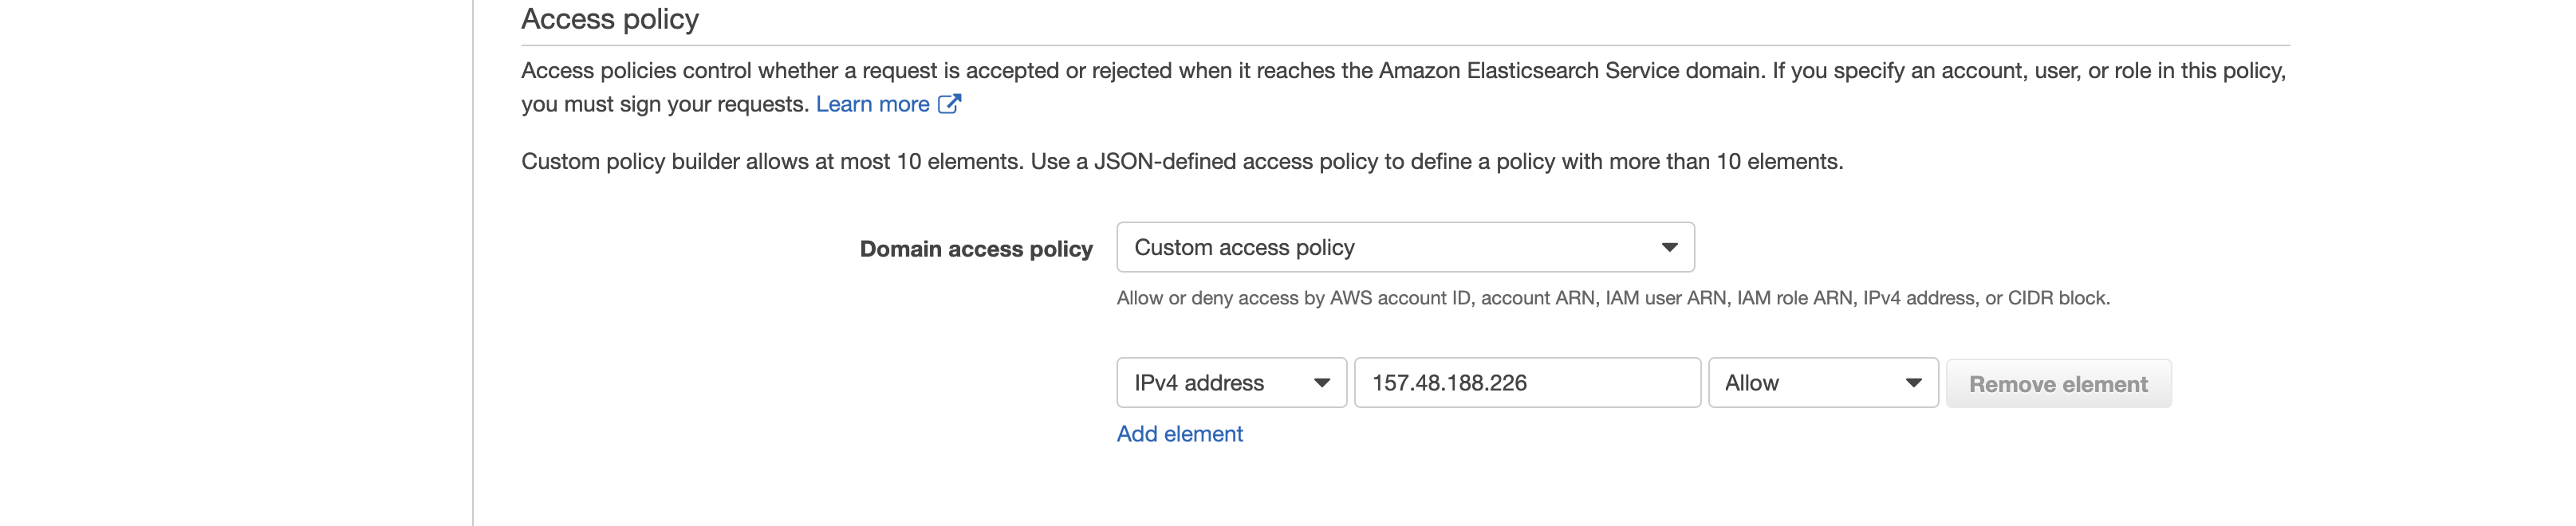
- Since the instance chosen is
t2.smallit does not supporthttpsencryption. Deselect that option.

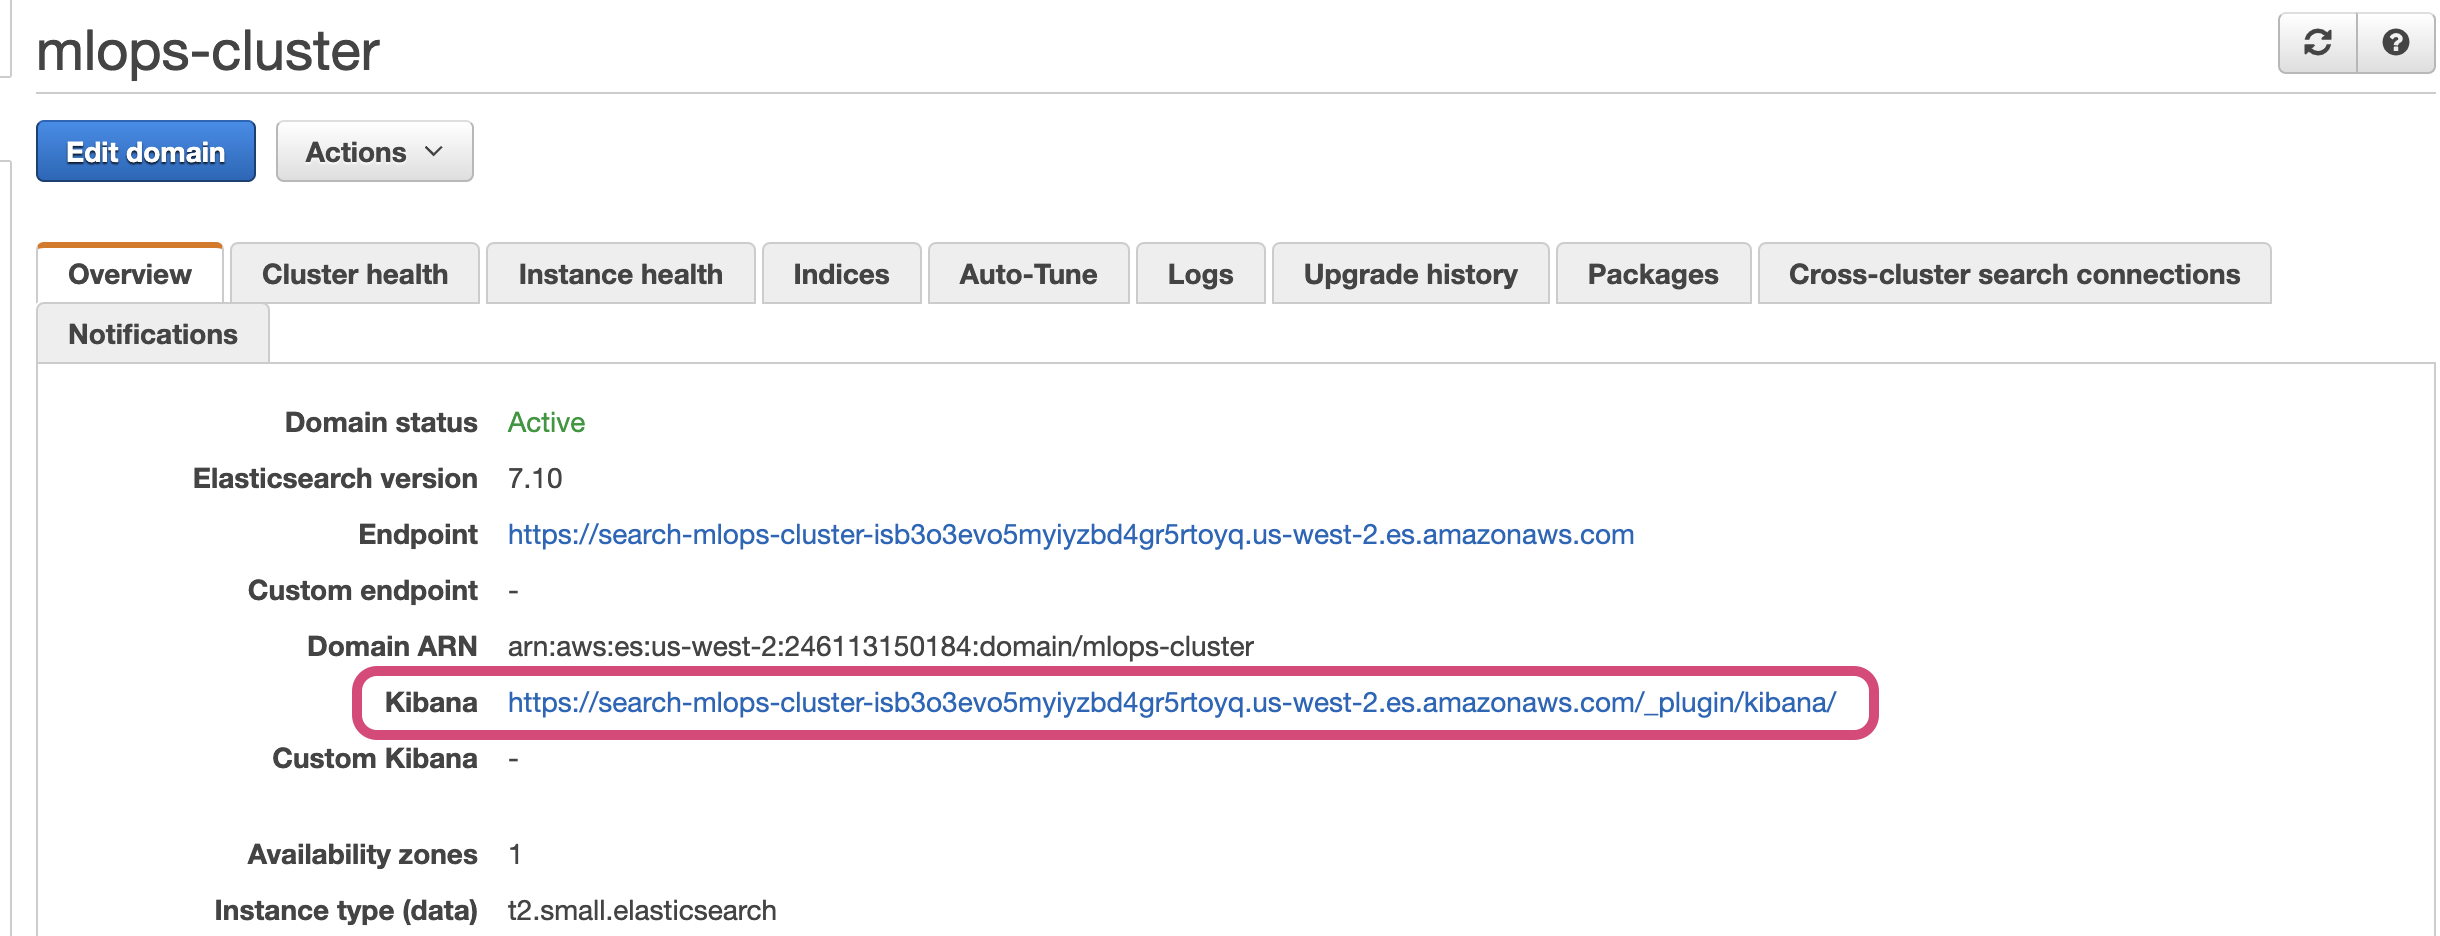
- After reviewing everything create the instance. This will take some time (5mins +). Once the cluster is created, the status will be shown as
Active.

Configuring Cloudwatch Logs with Elastic Search
Creating a IAM role with necessary permissions
In order to stream logs to Elasticsearch cluster, Cloudwatch should have necessary permissions to write to ES Cluster. Let's a create a role with the permissions required.
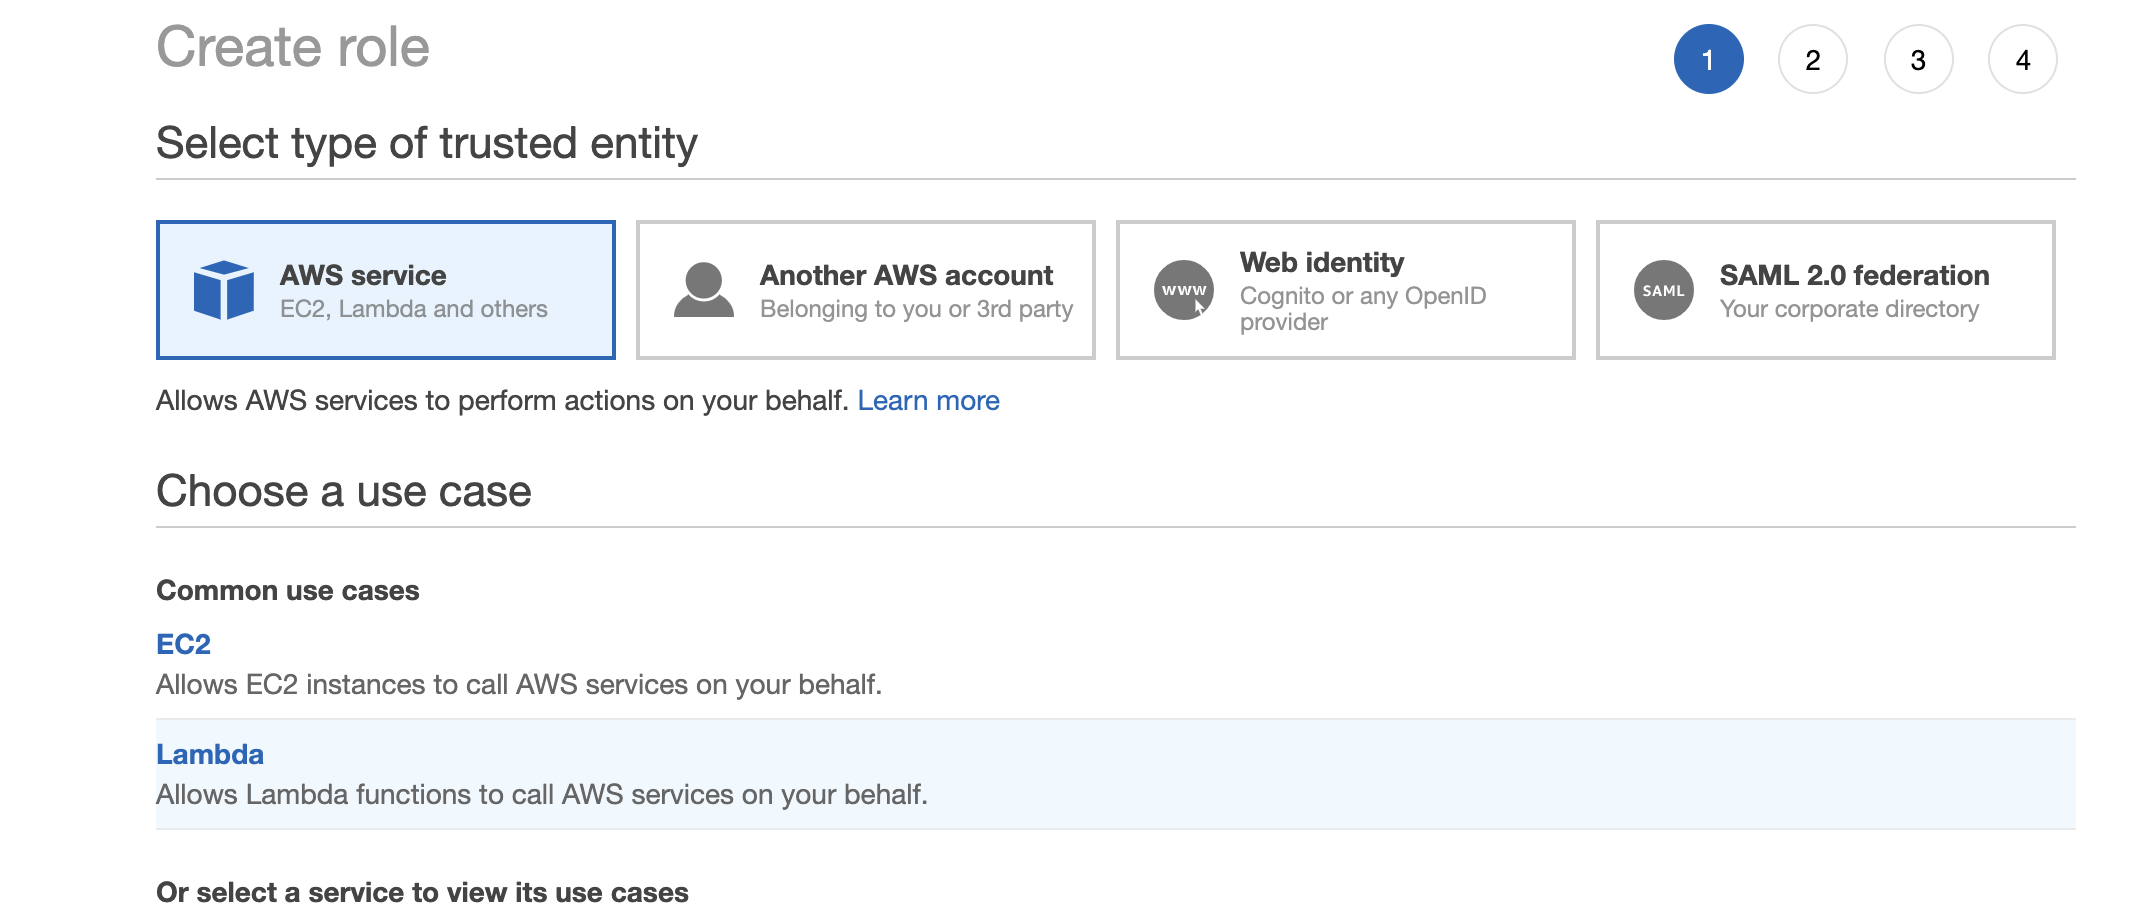
- Go to the IAM console and
Rolessection. Click onCreate Role

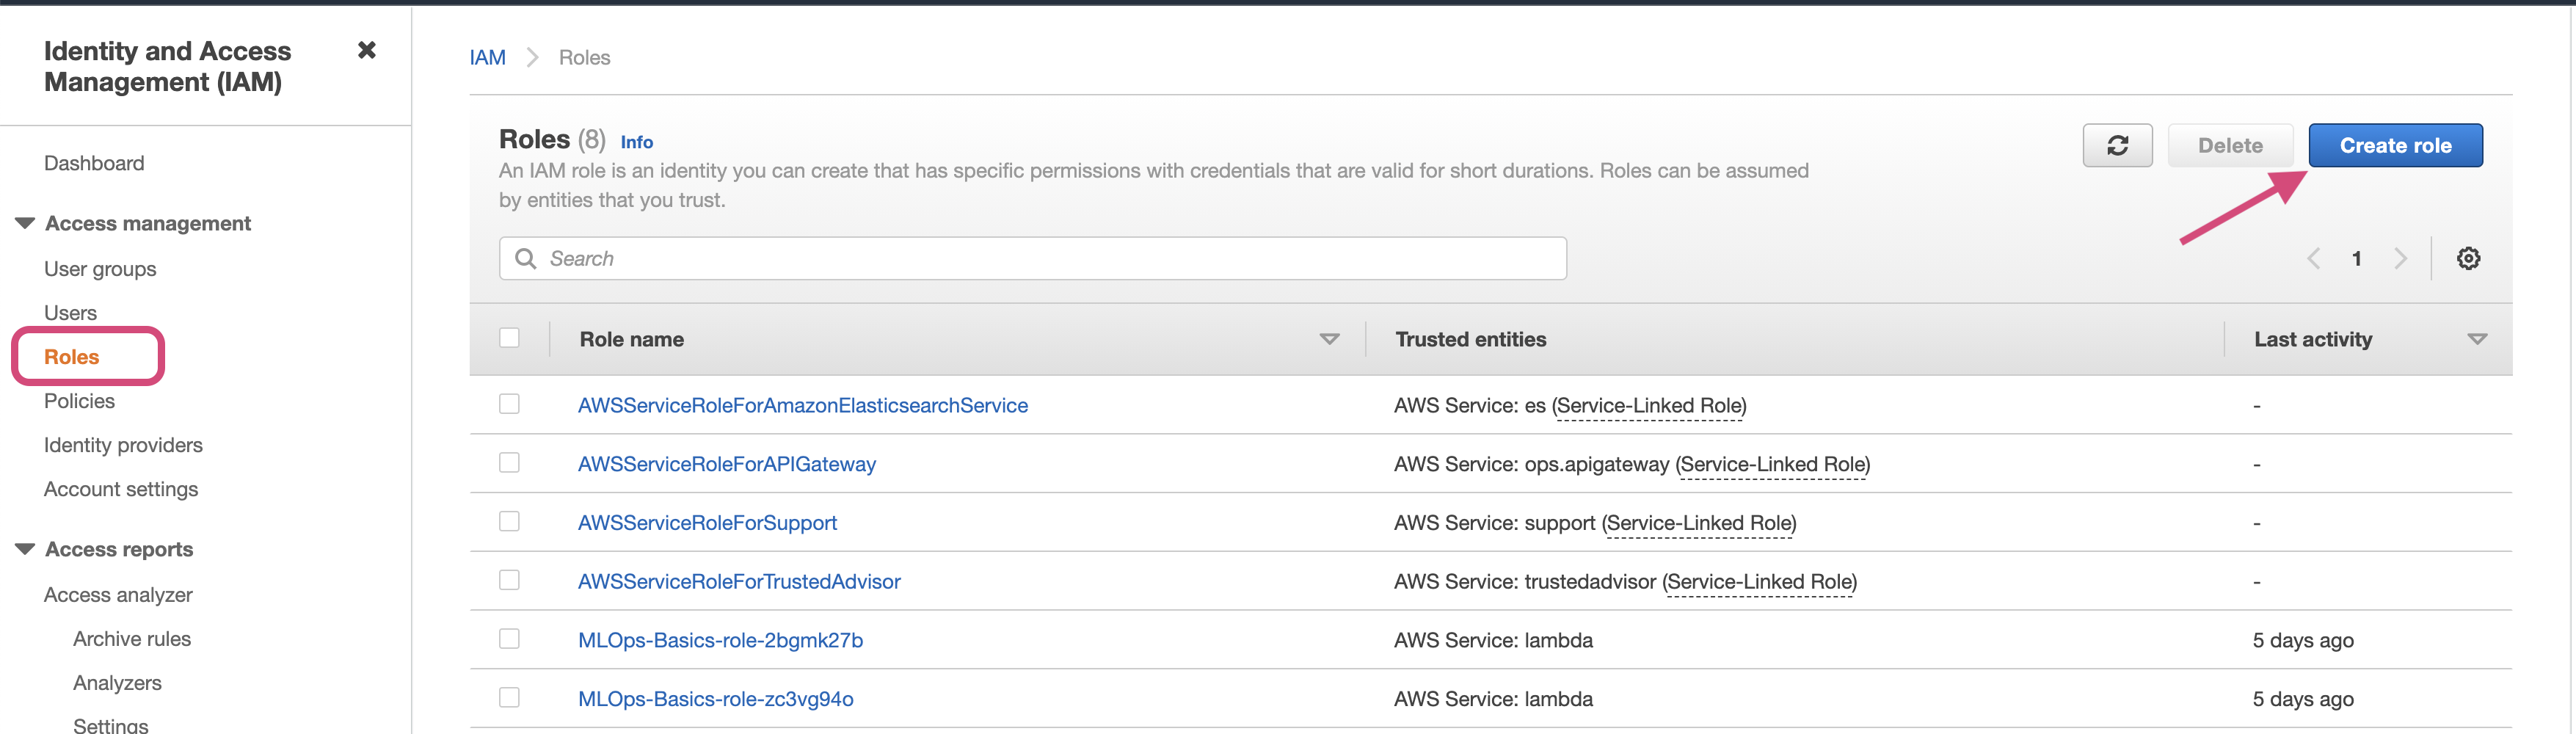
- Select the
AWS Serviceand the use case asLambda

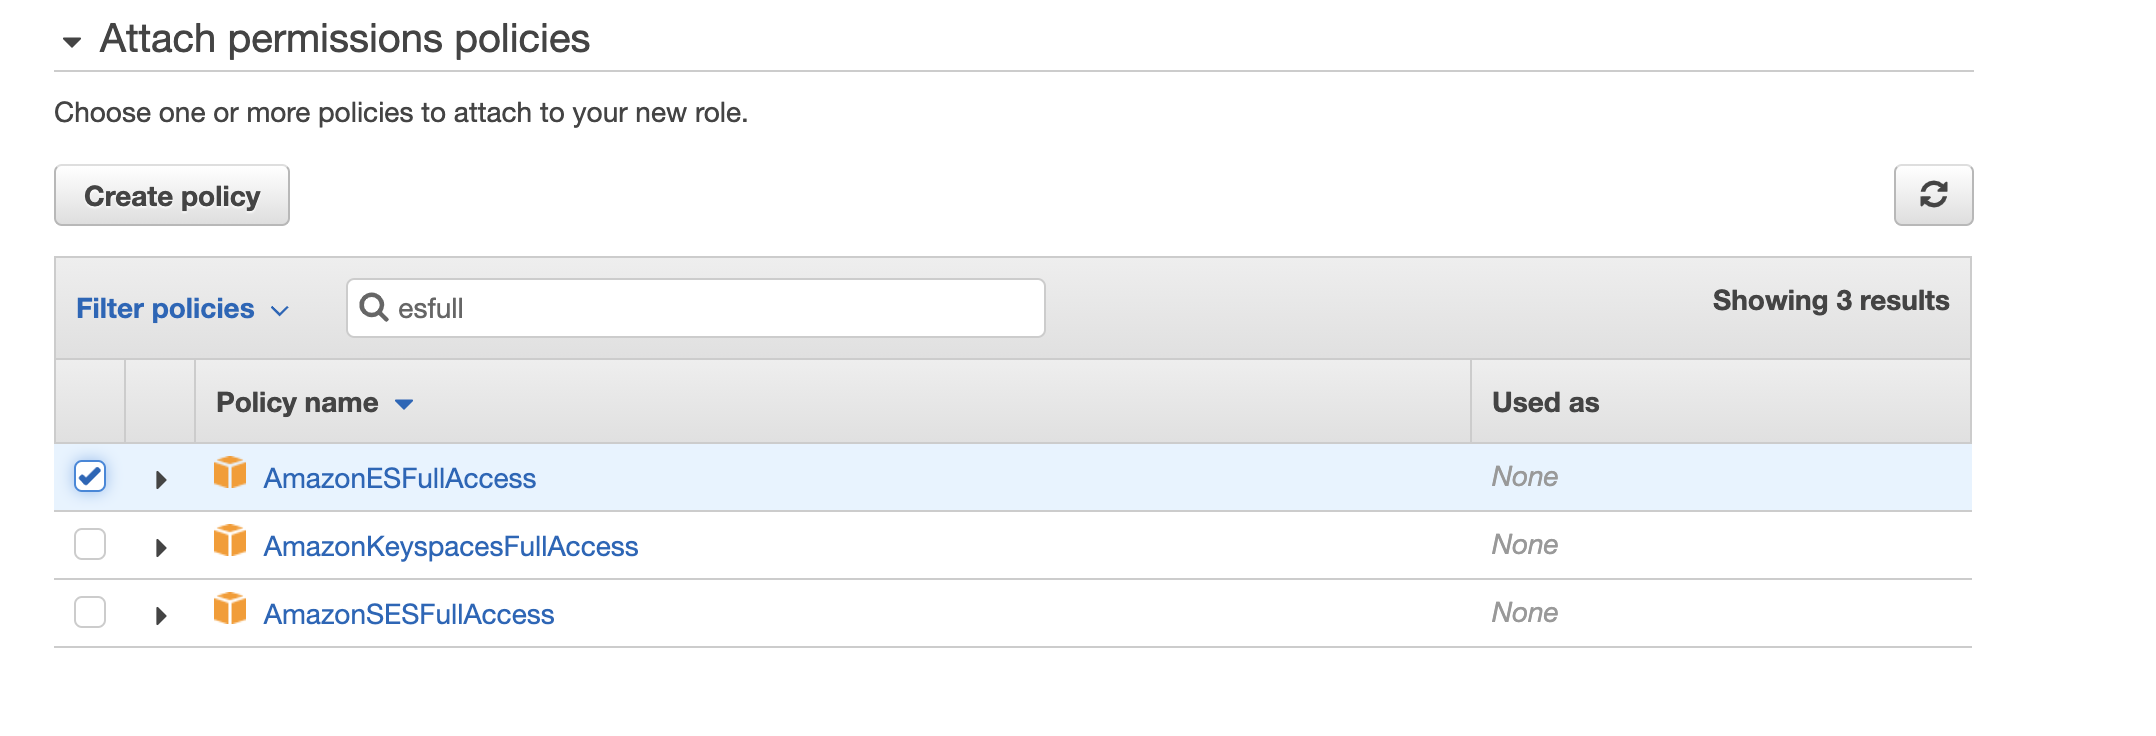
- Search for
esfulland select theAmazonESFullAccesspolicy.

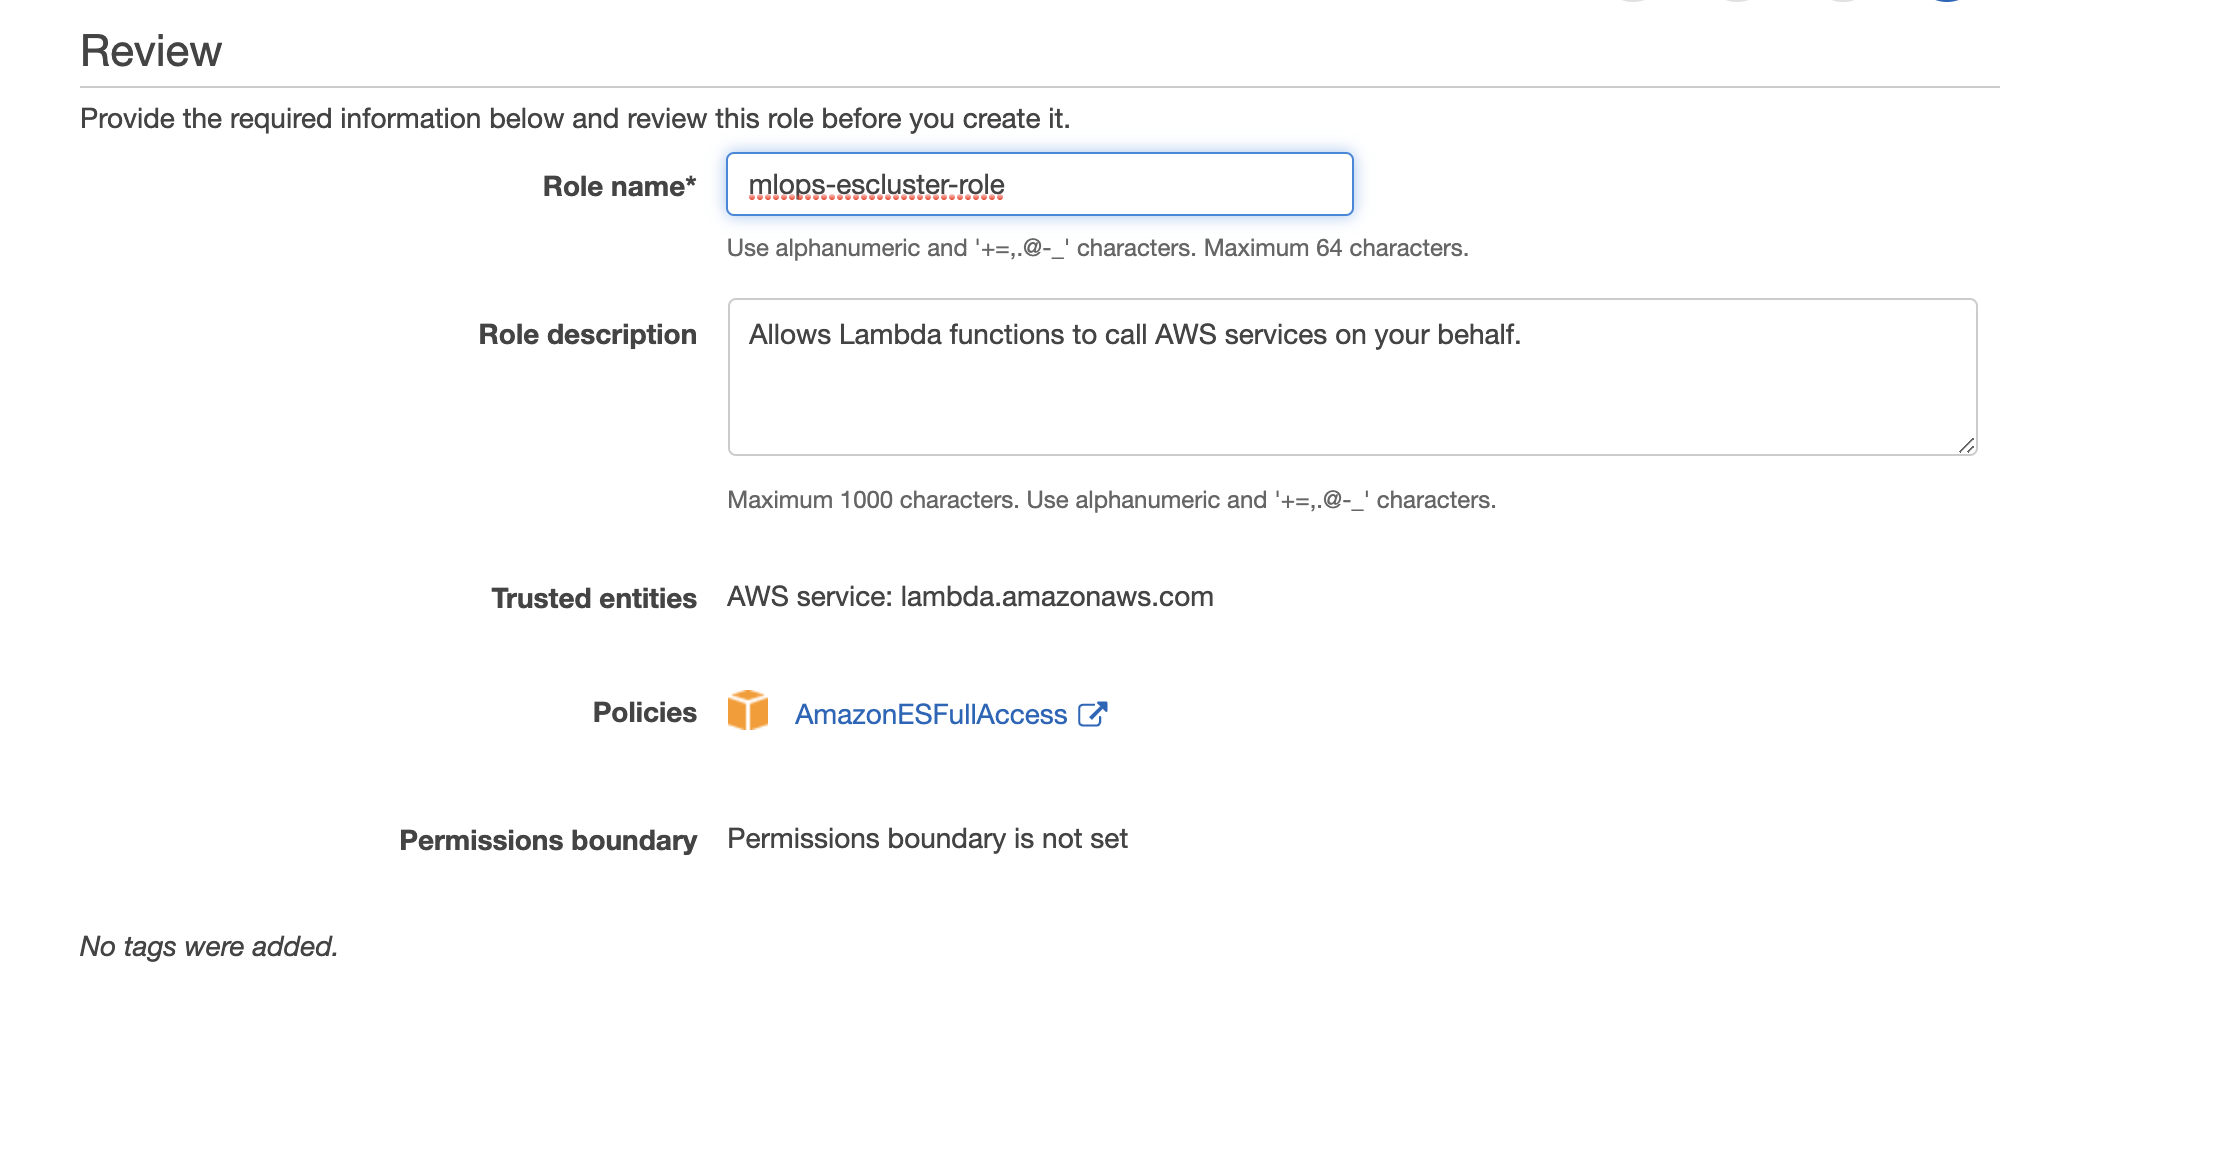
- Give the role a name
mlops-cluster-roleand save it.

Configuring Elasticsearch cluster to Cloudwatch logs
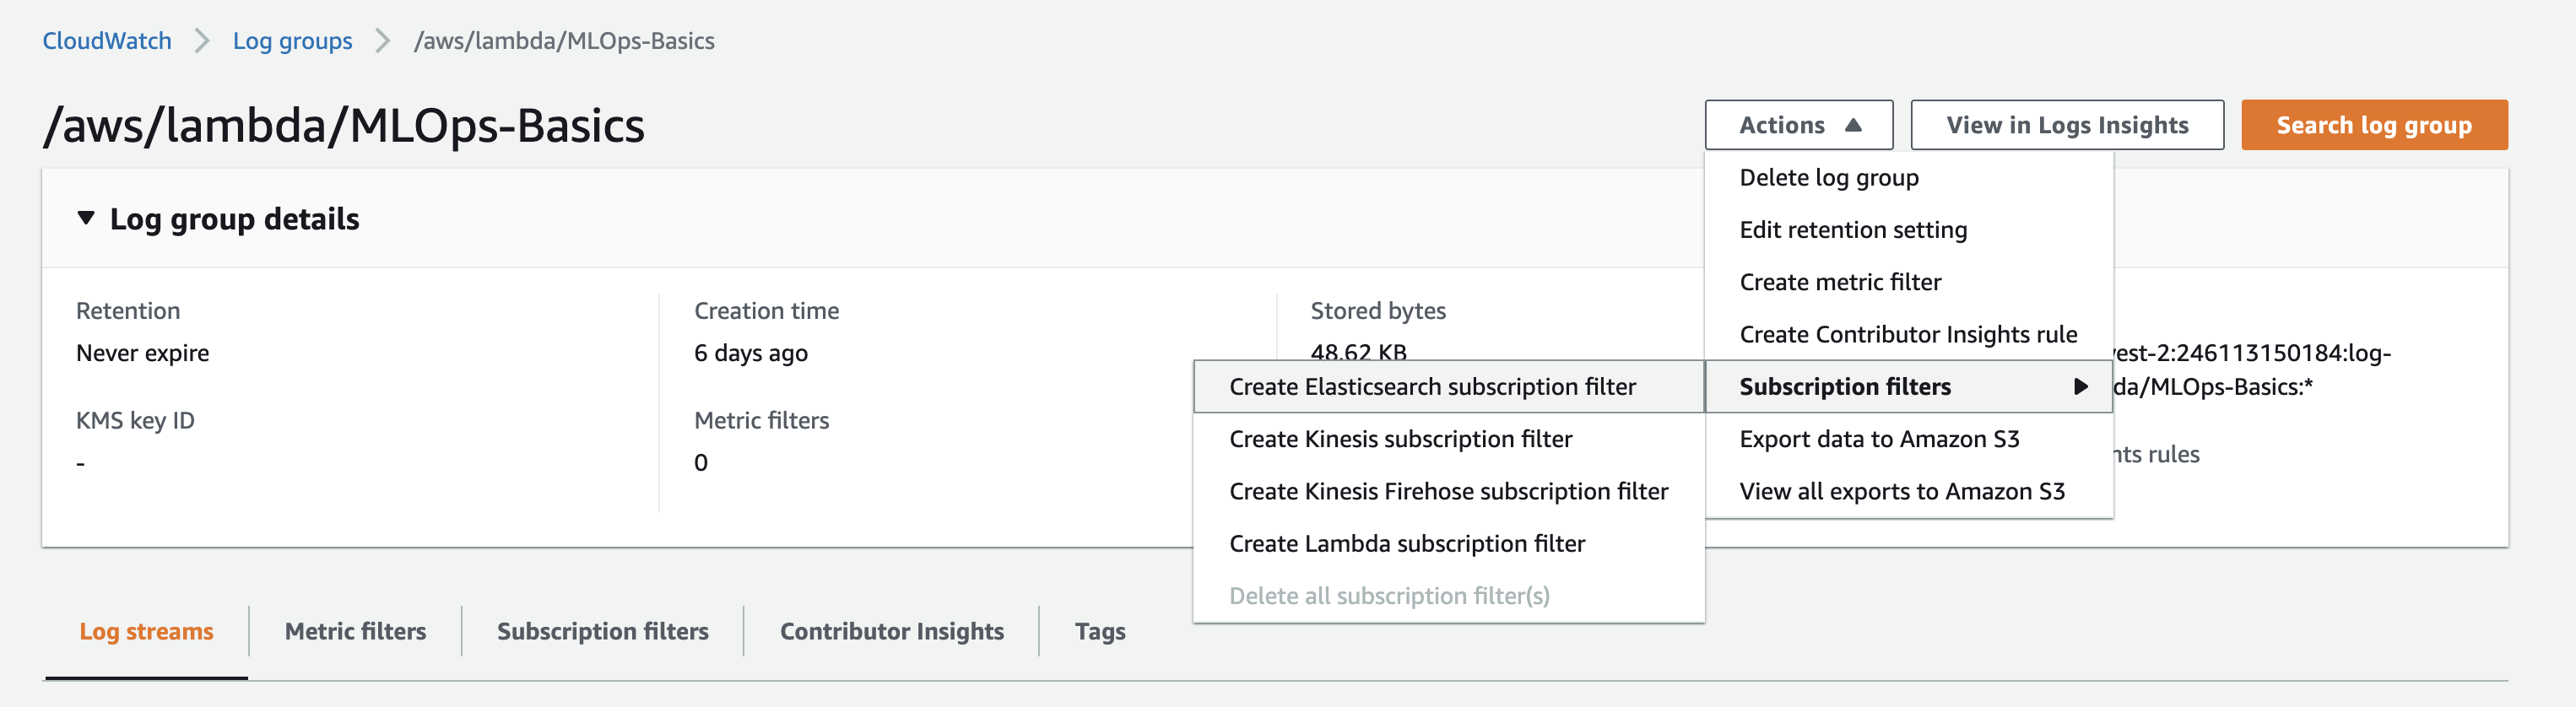
- Now that the role has created, go to the cloudwatch
Log Groupof the lambda. UnderActions/Subscription Filtersthere will beCreate Elasticsearch Subscription Filter. Select it.

- Select
mlops-clusterunder the Amazon ES cluster option. Select themlops-cluster-roleIAM Execution role.

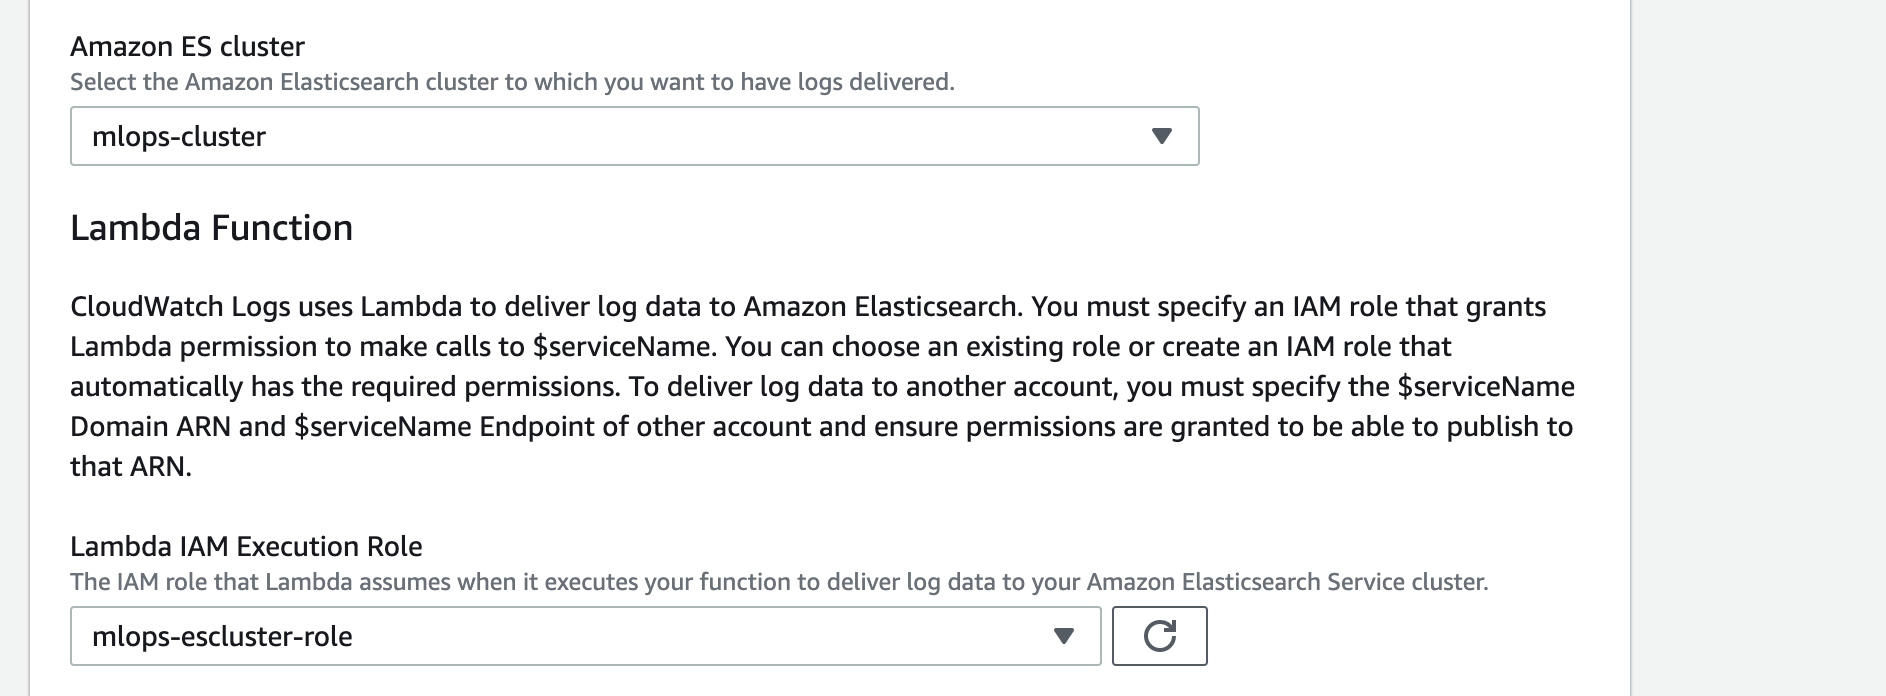
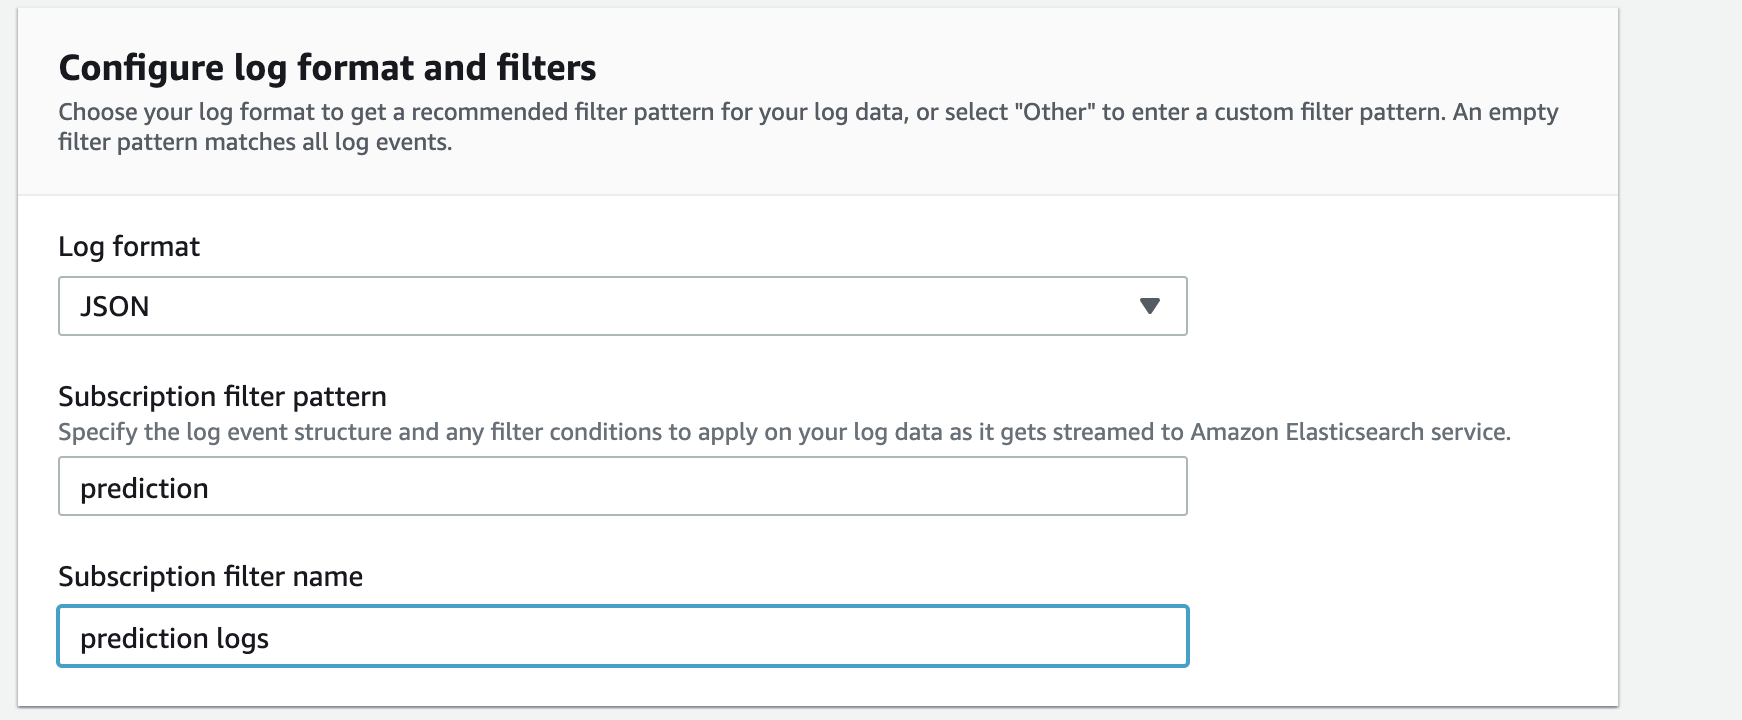
- Select the Log format as
JSON, since we are printing the logs in Json format. Filter patterns will help in filtering the unnecessary logs and focus on the necessary ones. As a simple usecase, let's write the filter pattern asprediction. This will filter the logs which has prediction in it.

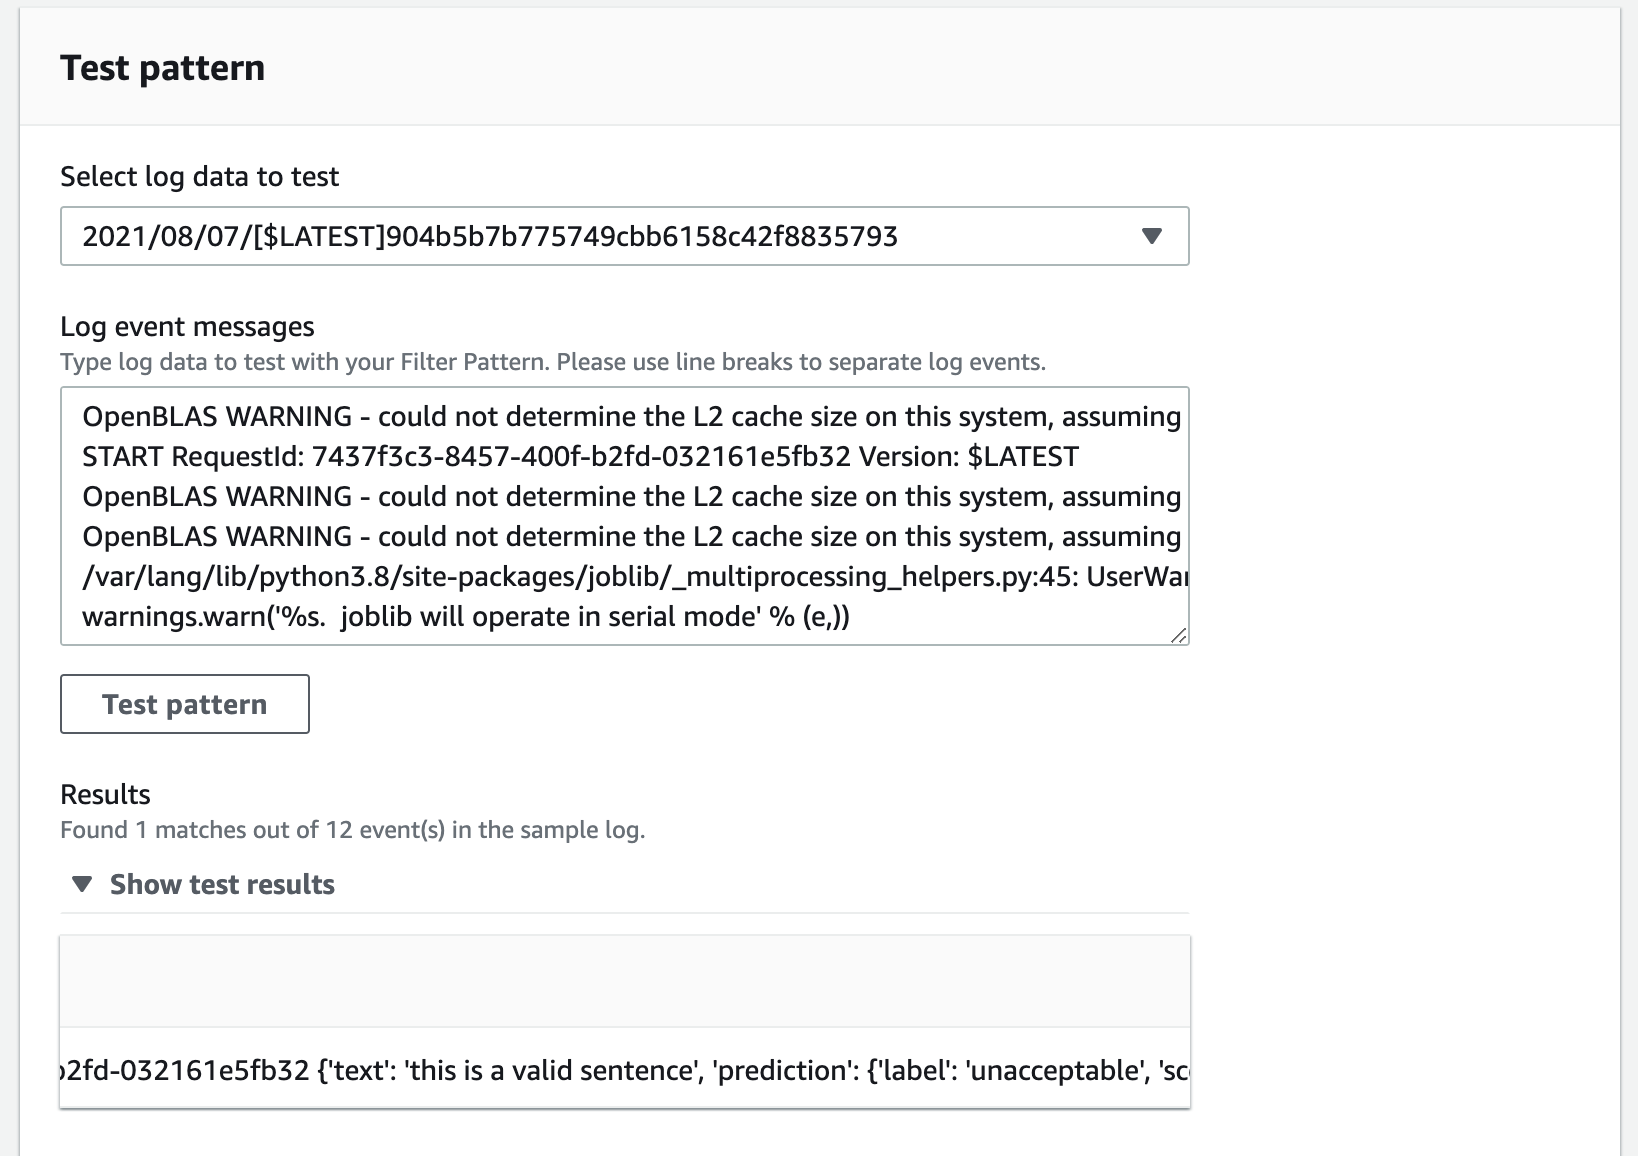
- Test the filter pattern by select one of the latest log stream and then click
Test Pattern. Now in the test results you can see only the prediction related logs.

- Cross check once the configuration and then create it.
Creating Index Patterns in Kibana
Now that cloudwatch is configured with Elasticsearch, let's go to Kibana dashboard. Kibana link can be accessed as below:
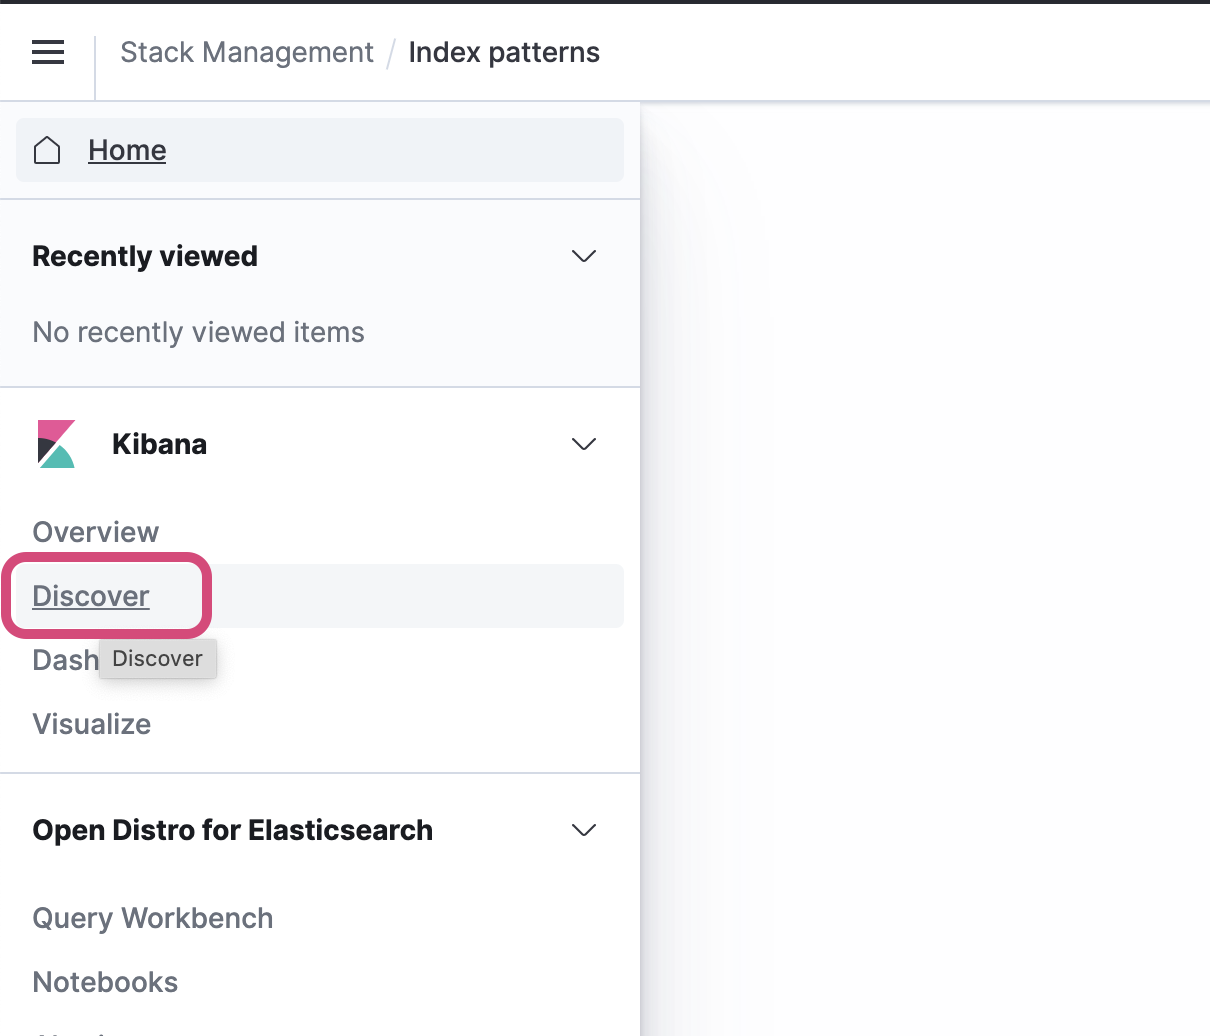
- Go to the
Discoversection.

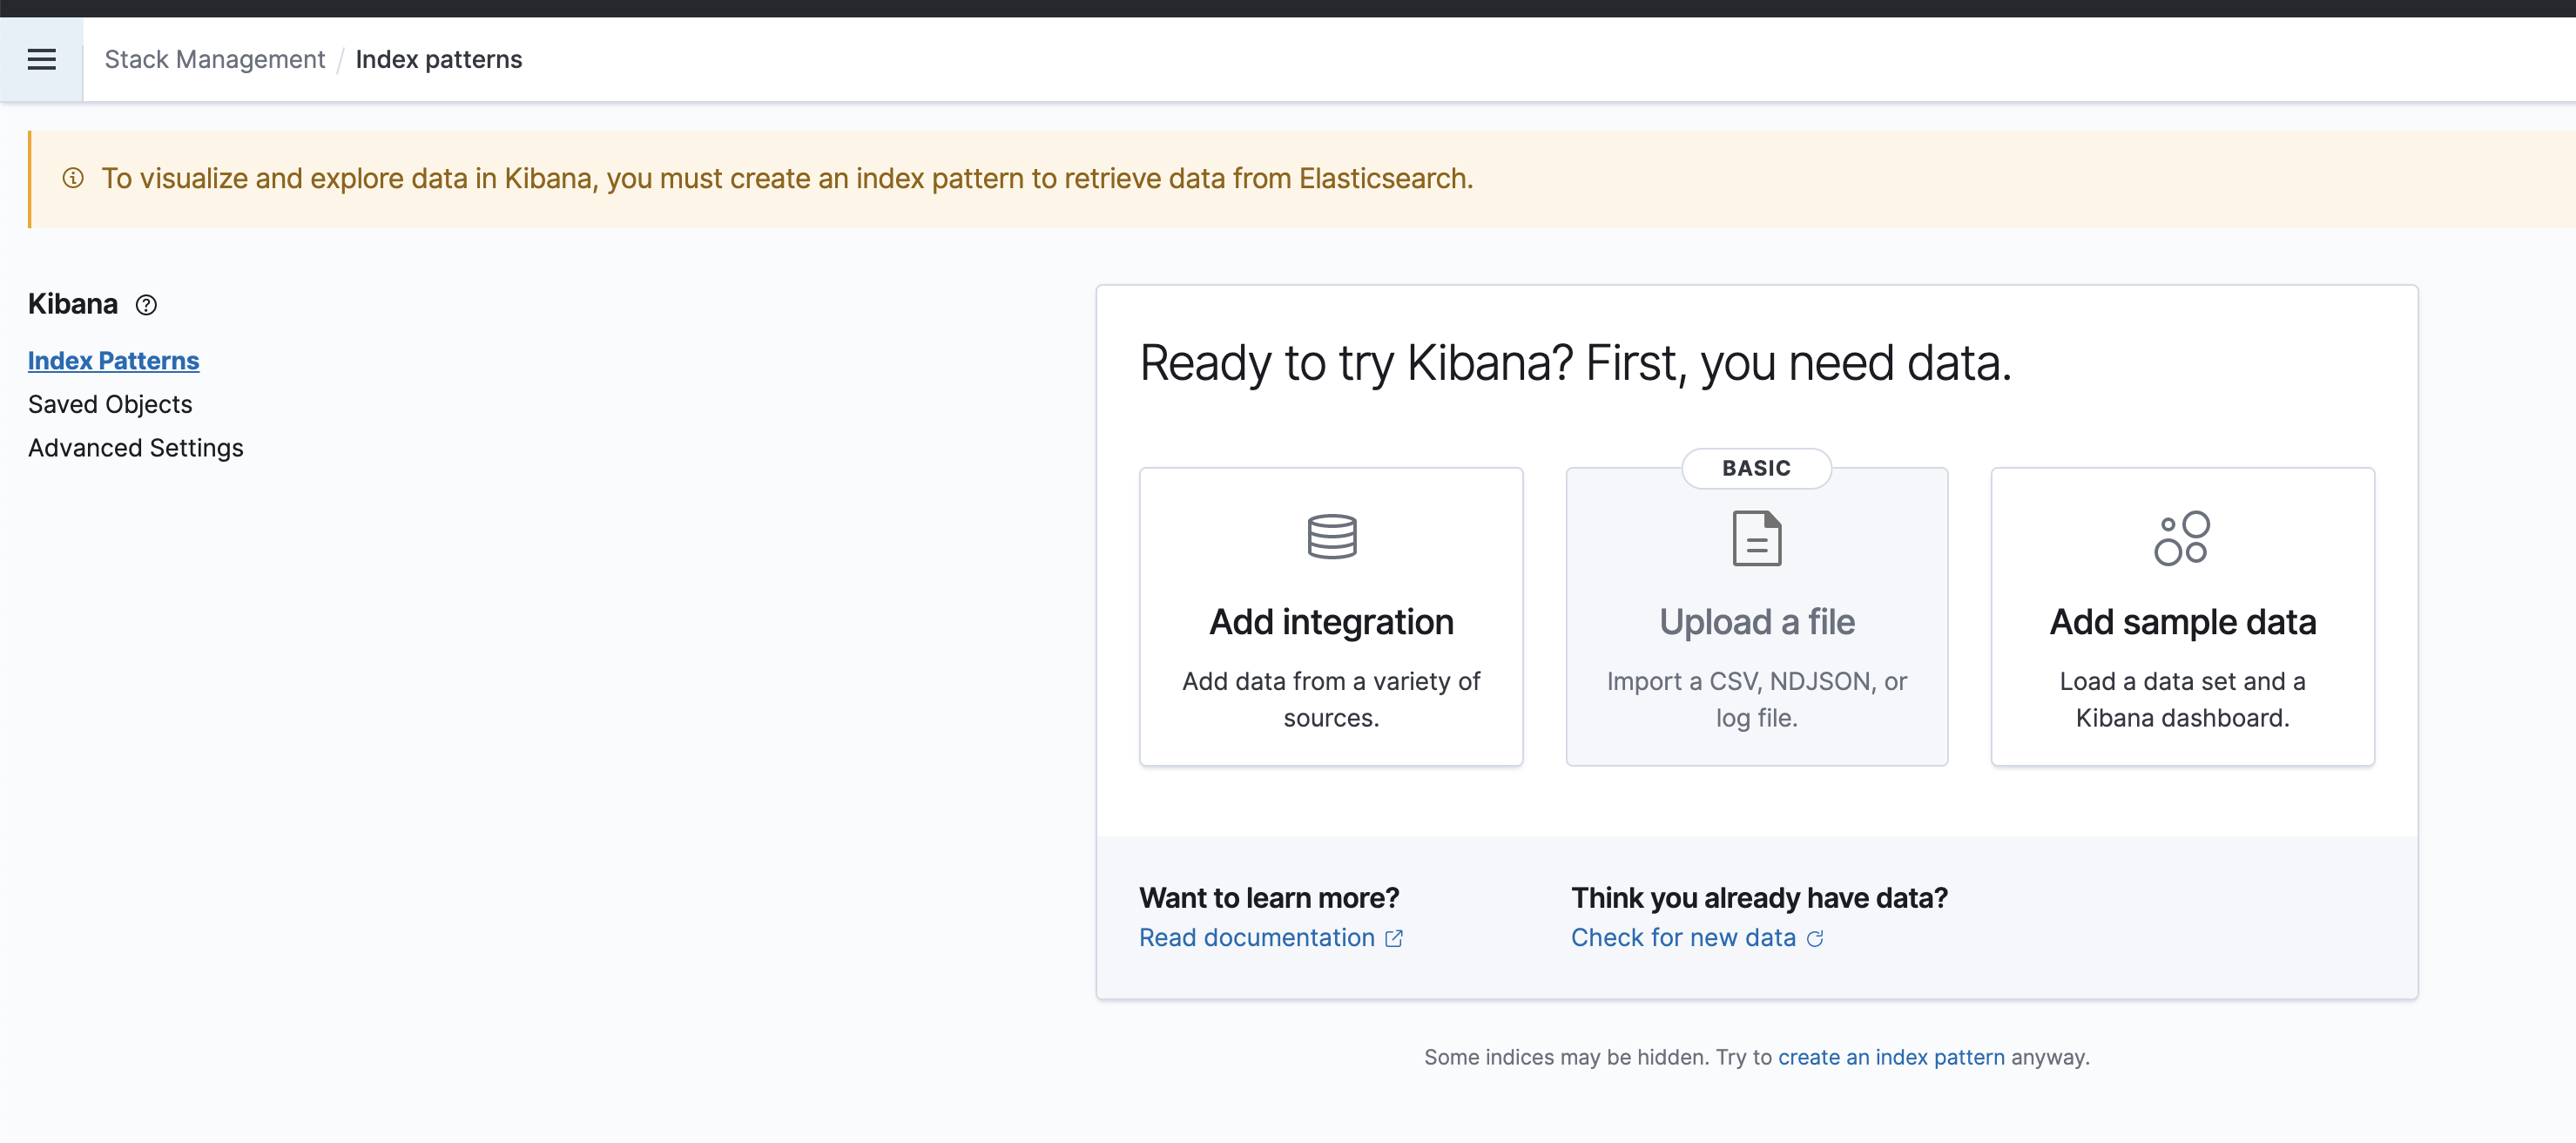
- You might see page like this. In that case fire some queries so that some logs will be created.

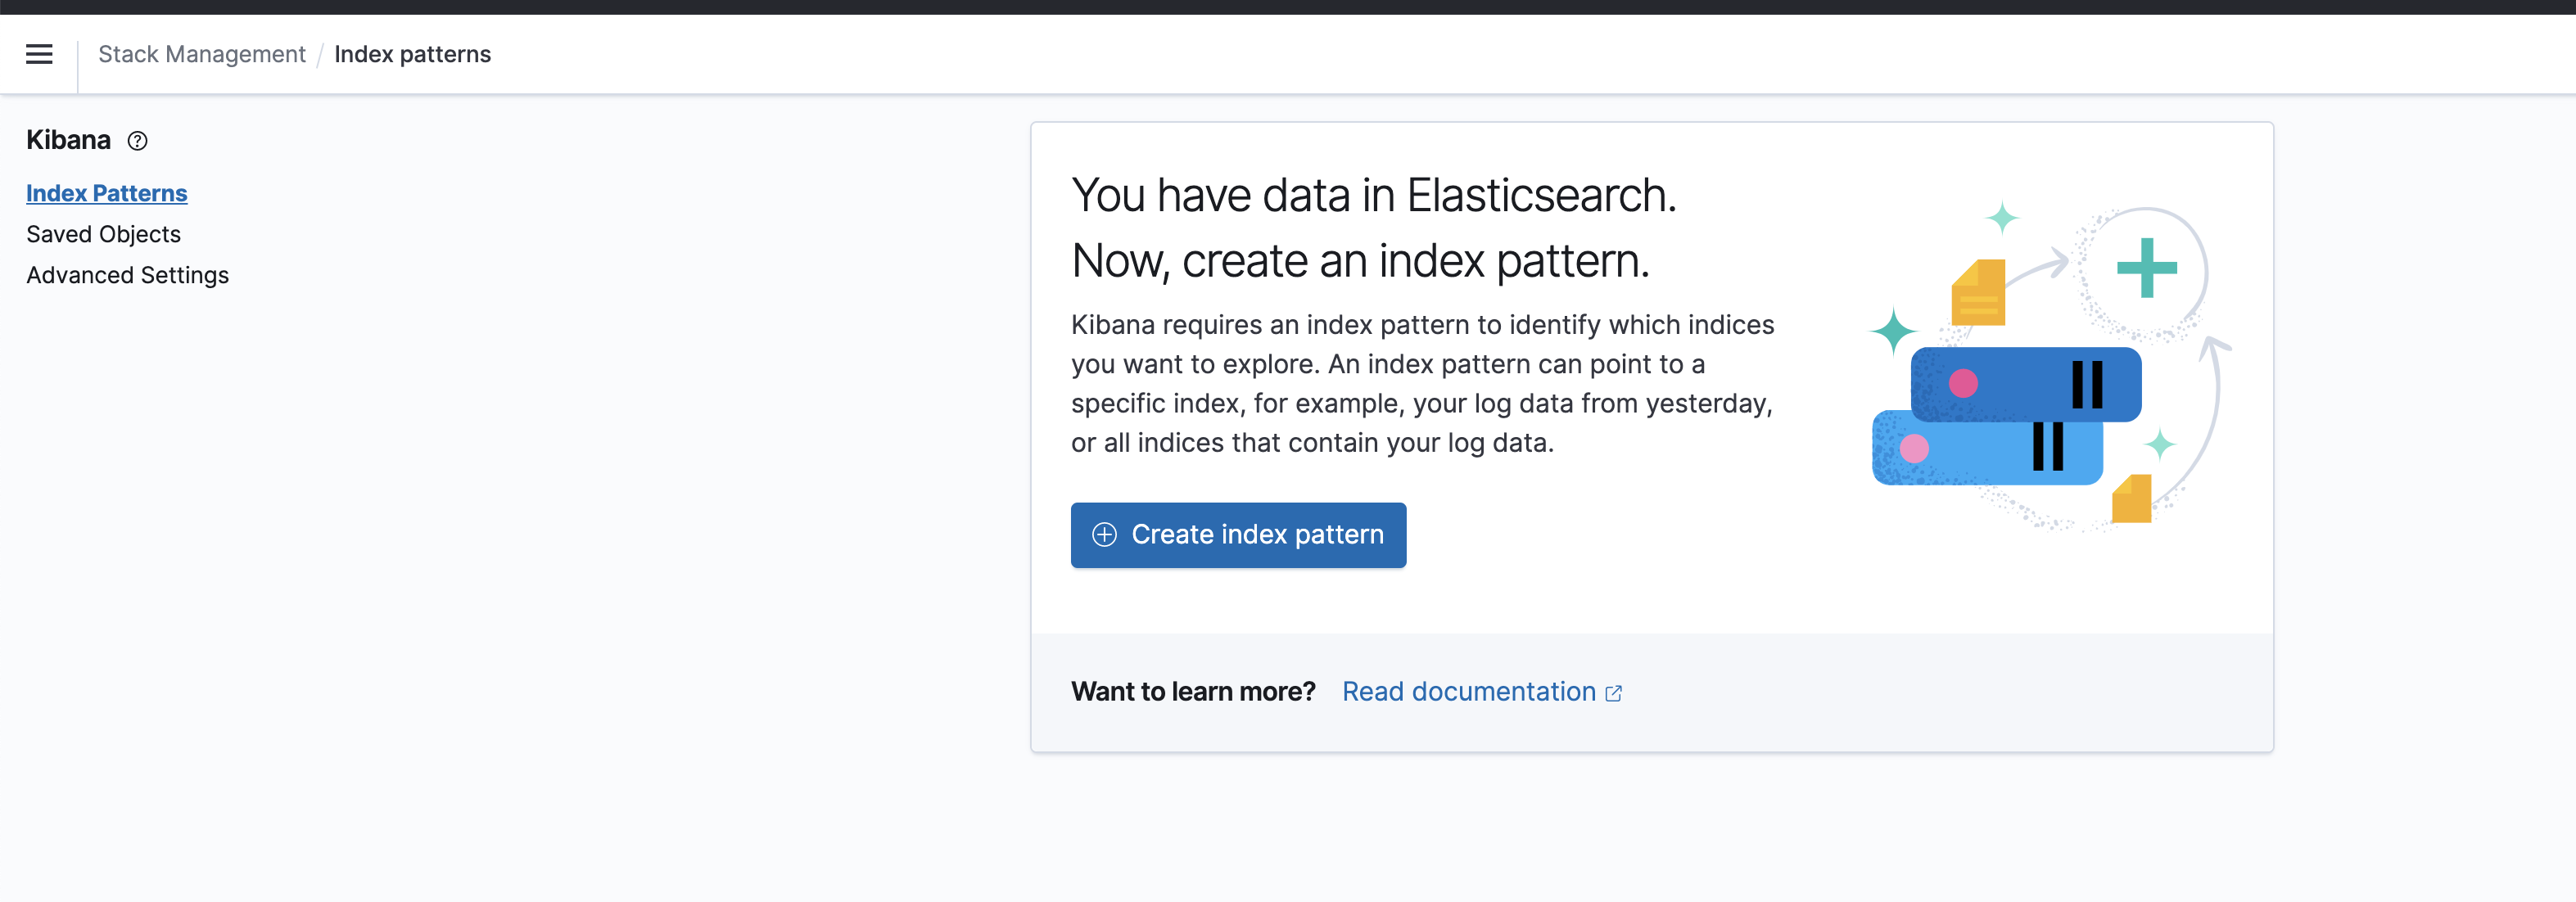
- Once few logs are there, the page will look like this. Click on
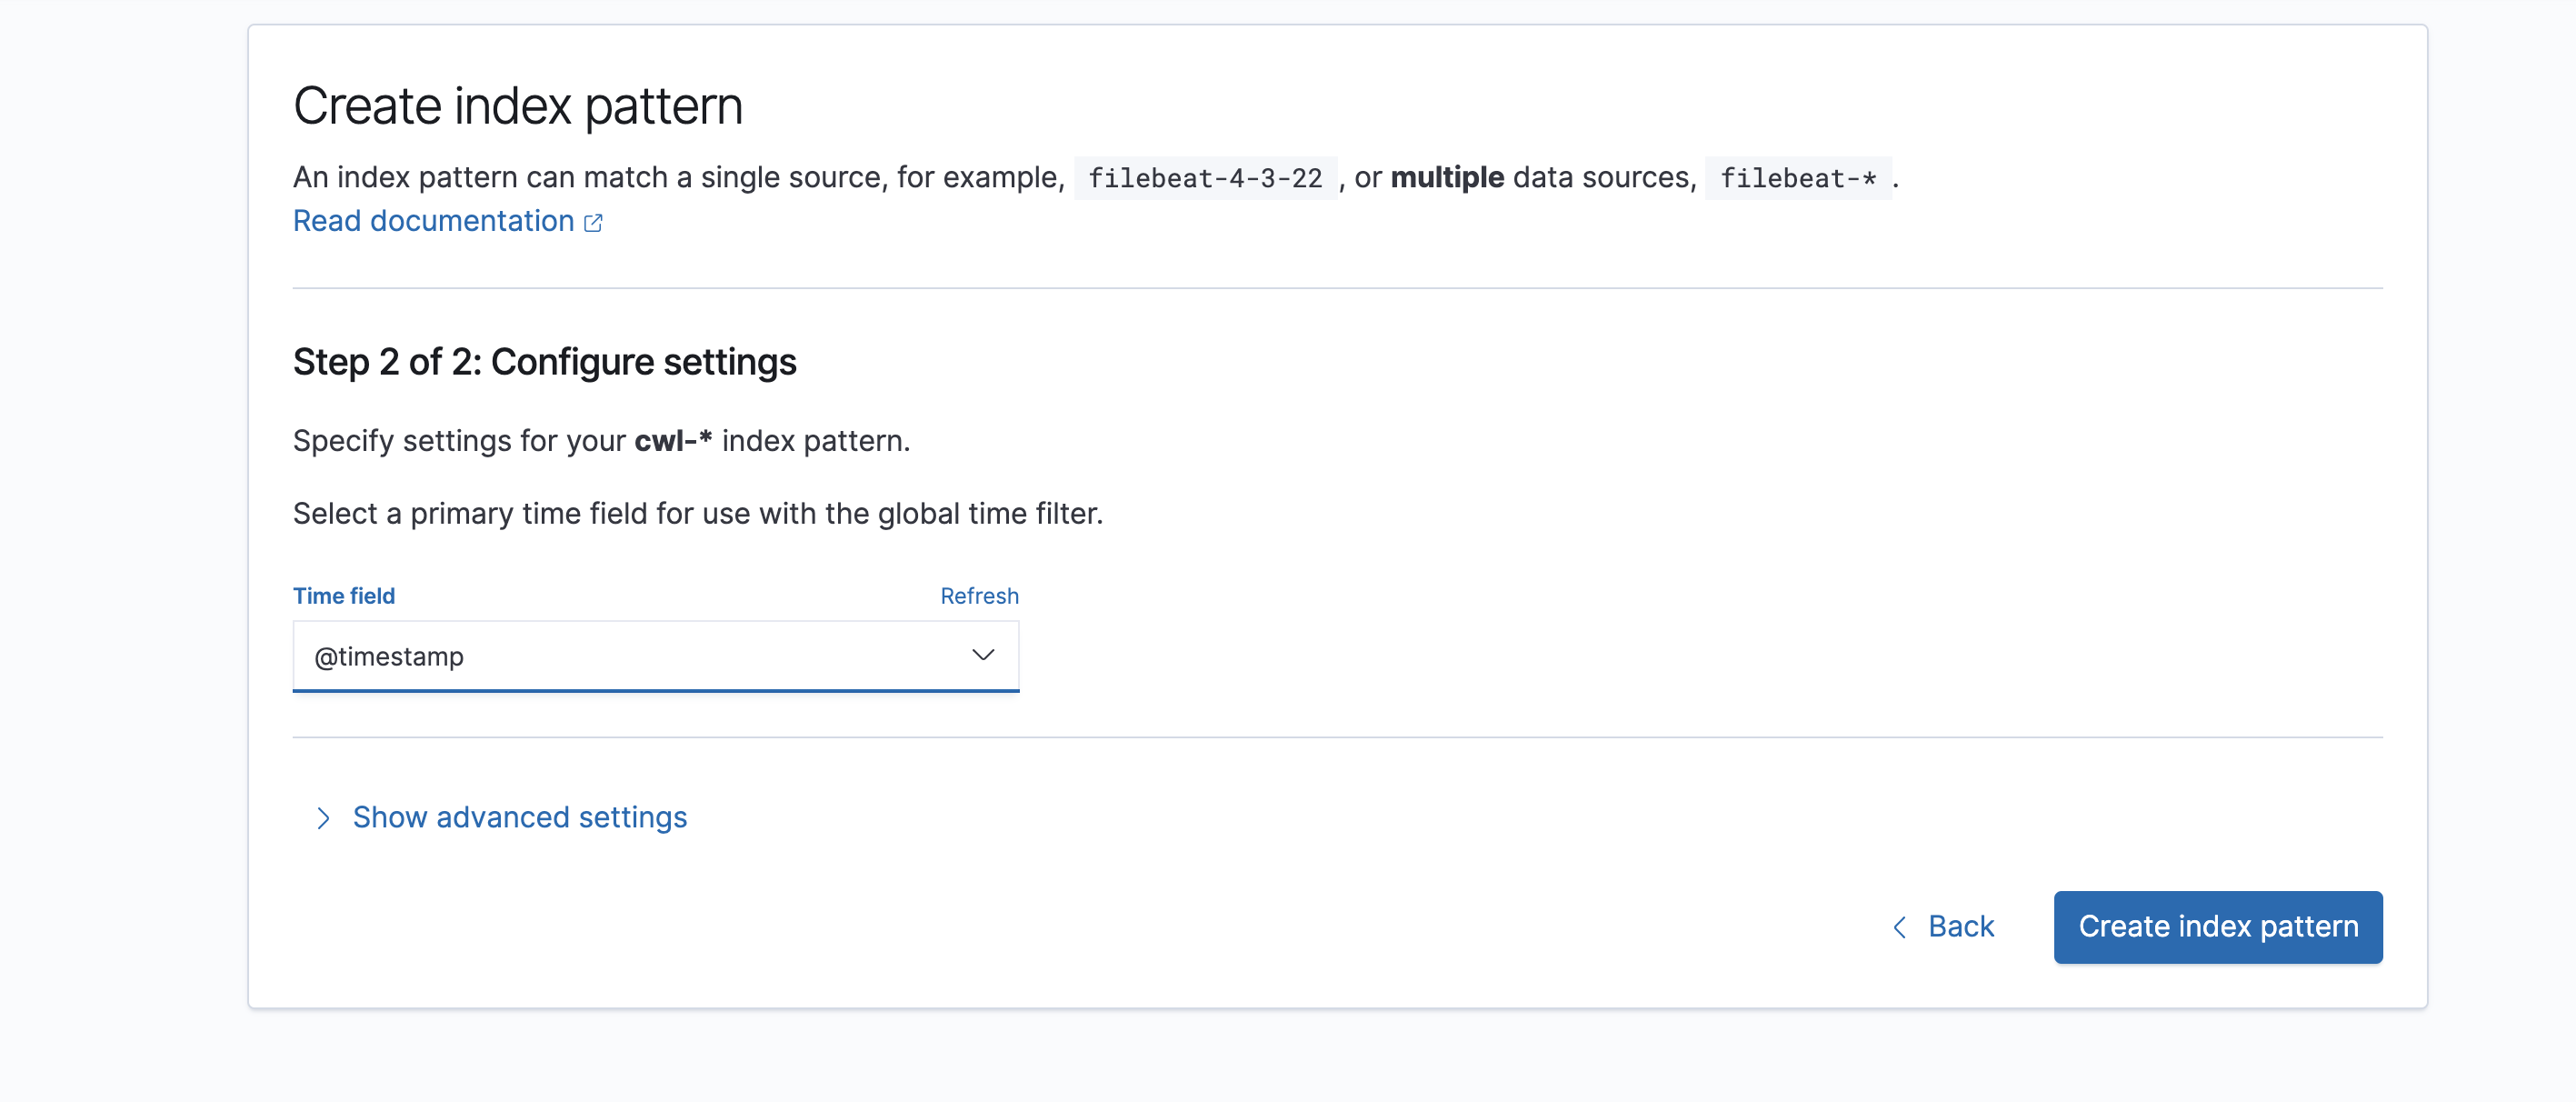
Create Index Pattern

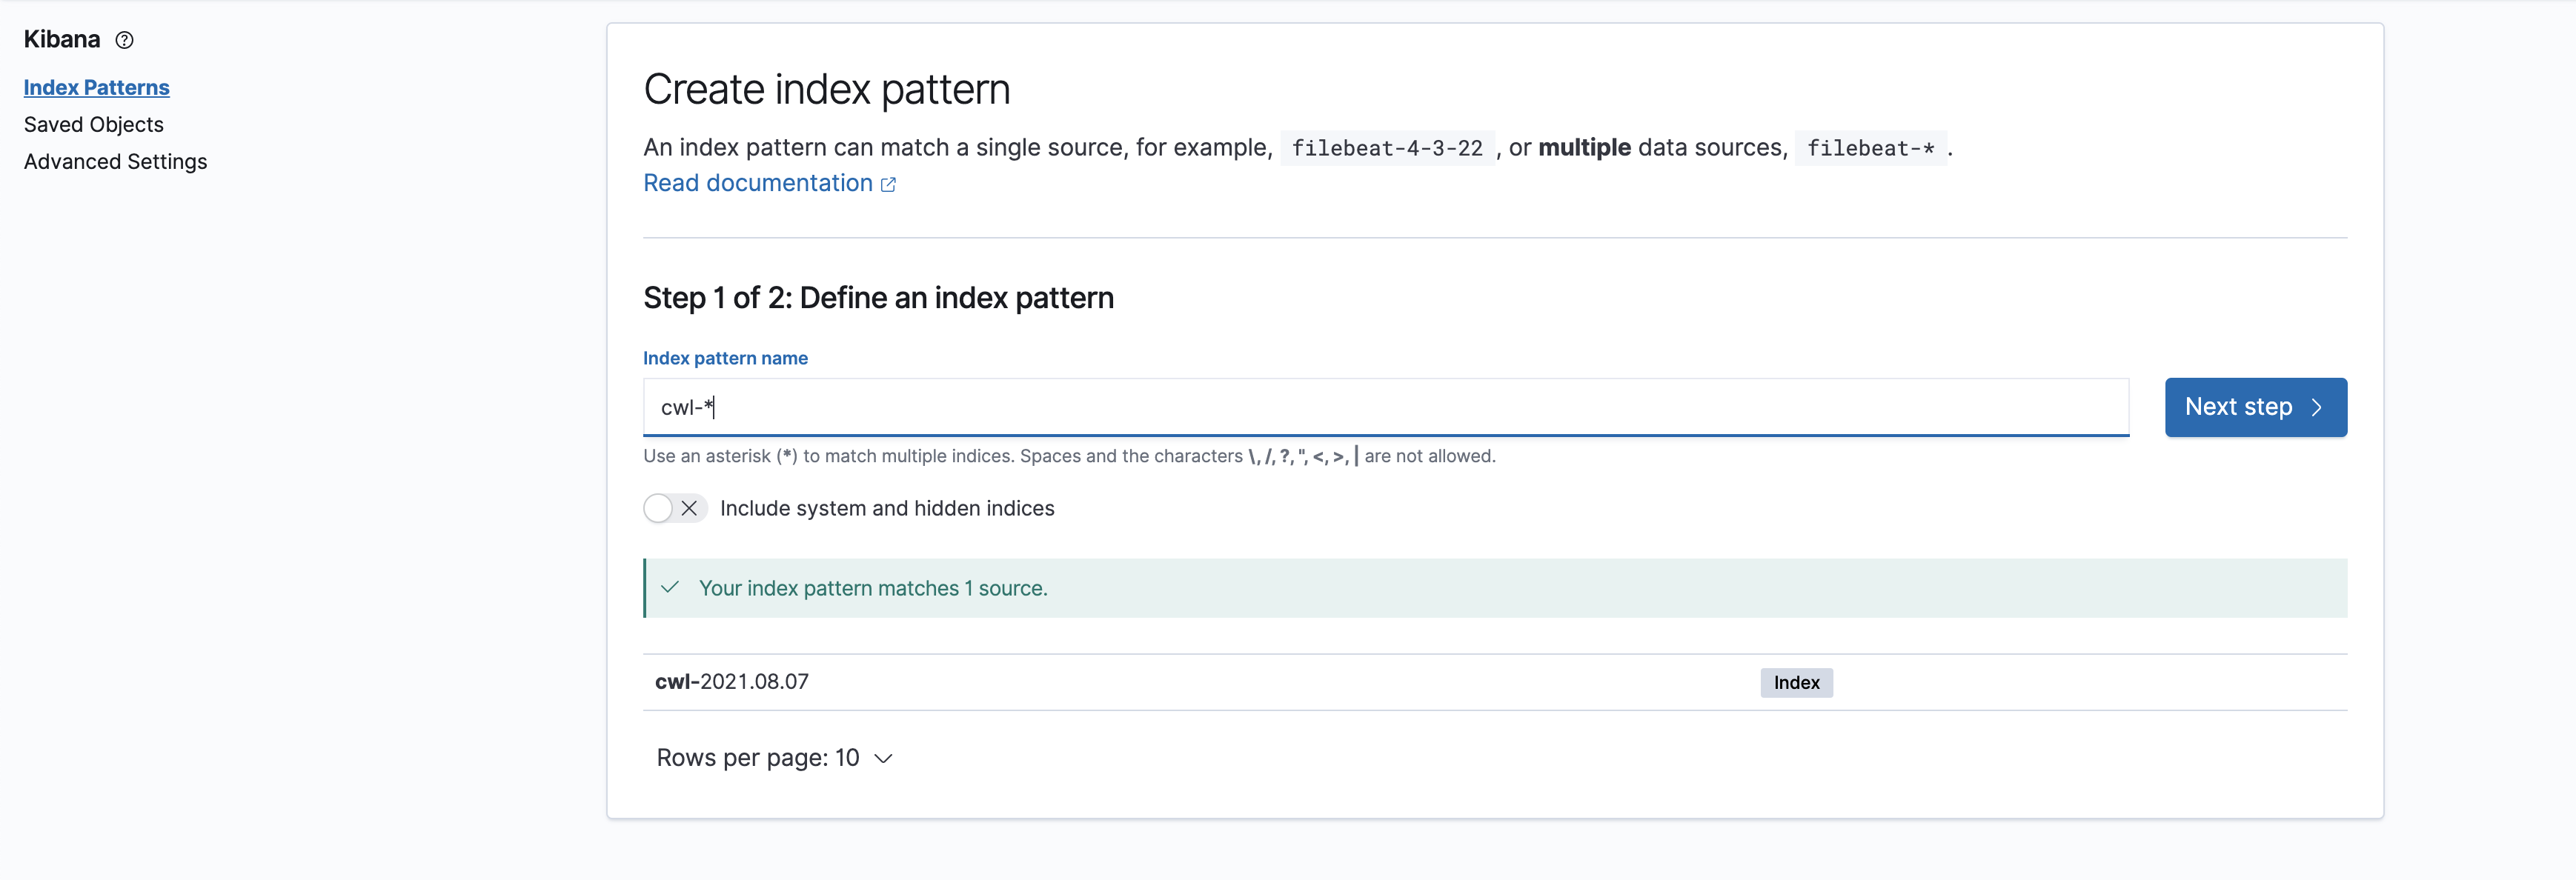
- Add the index pattern as
cwl-*which indicates all the Cloudwatch Logs.

- Include the
@timestampfield also

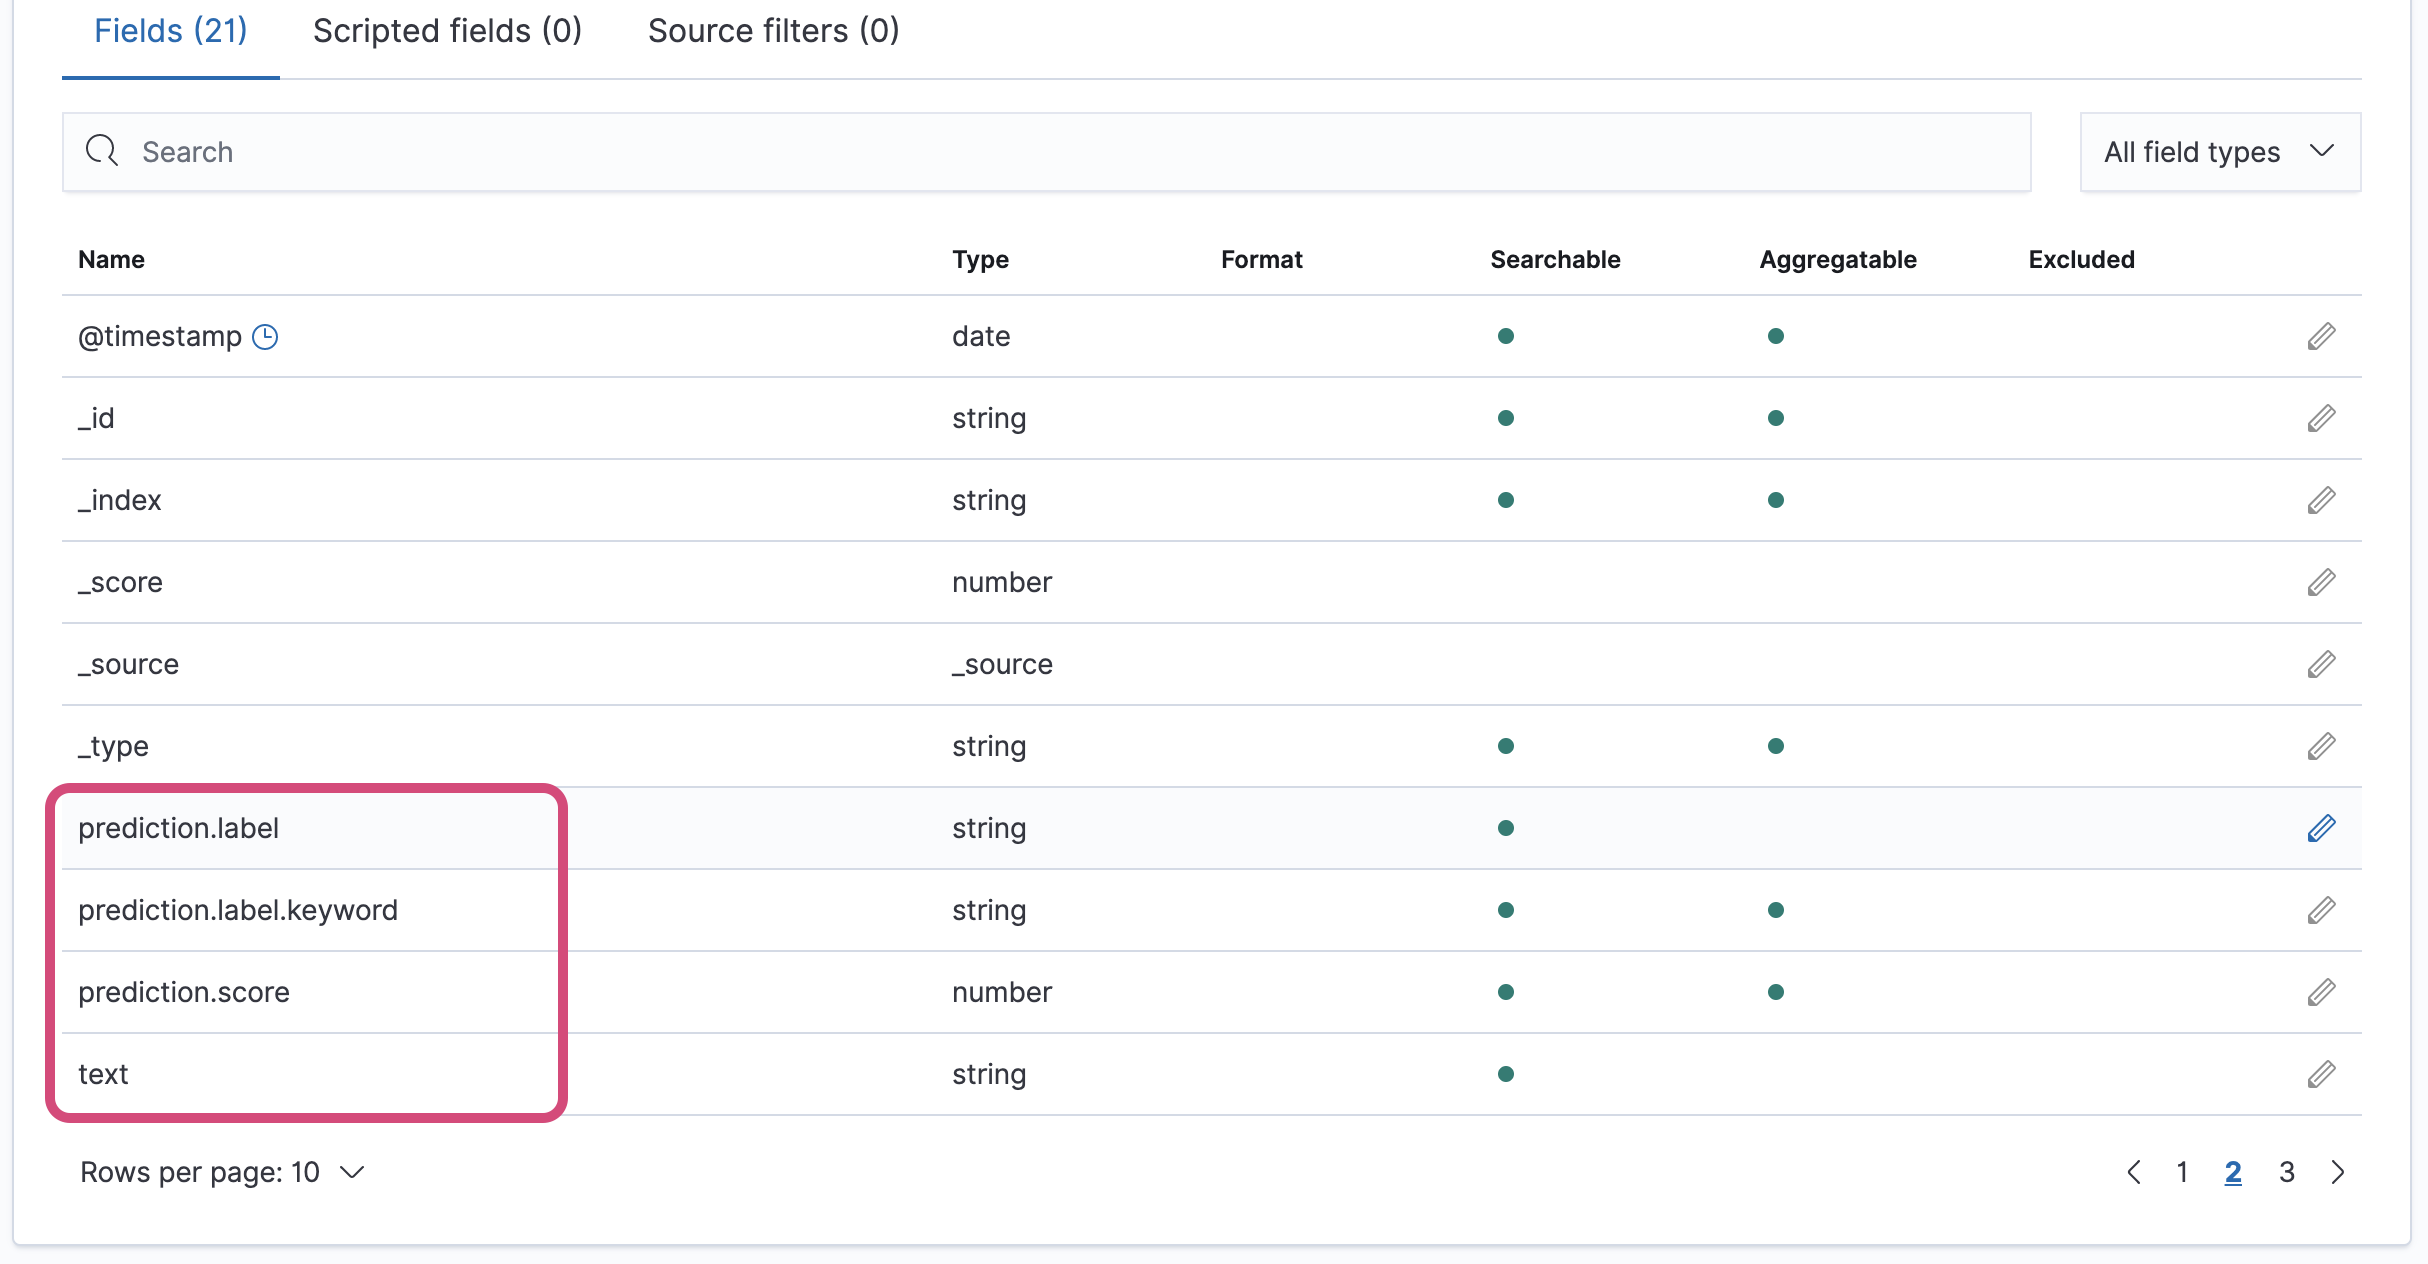
- Now we can see
prediction.label,prediction.label.keyword,prediction.score,textin the extracted fields.

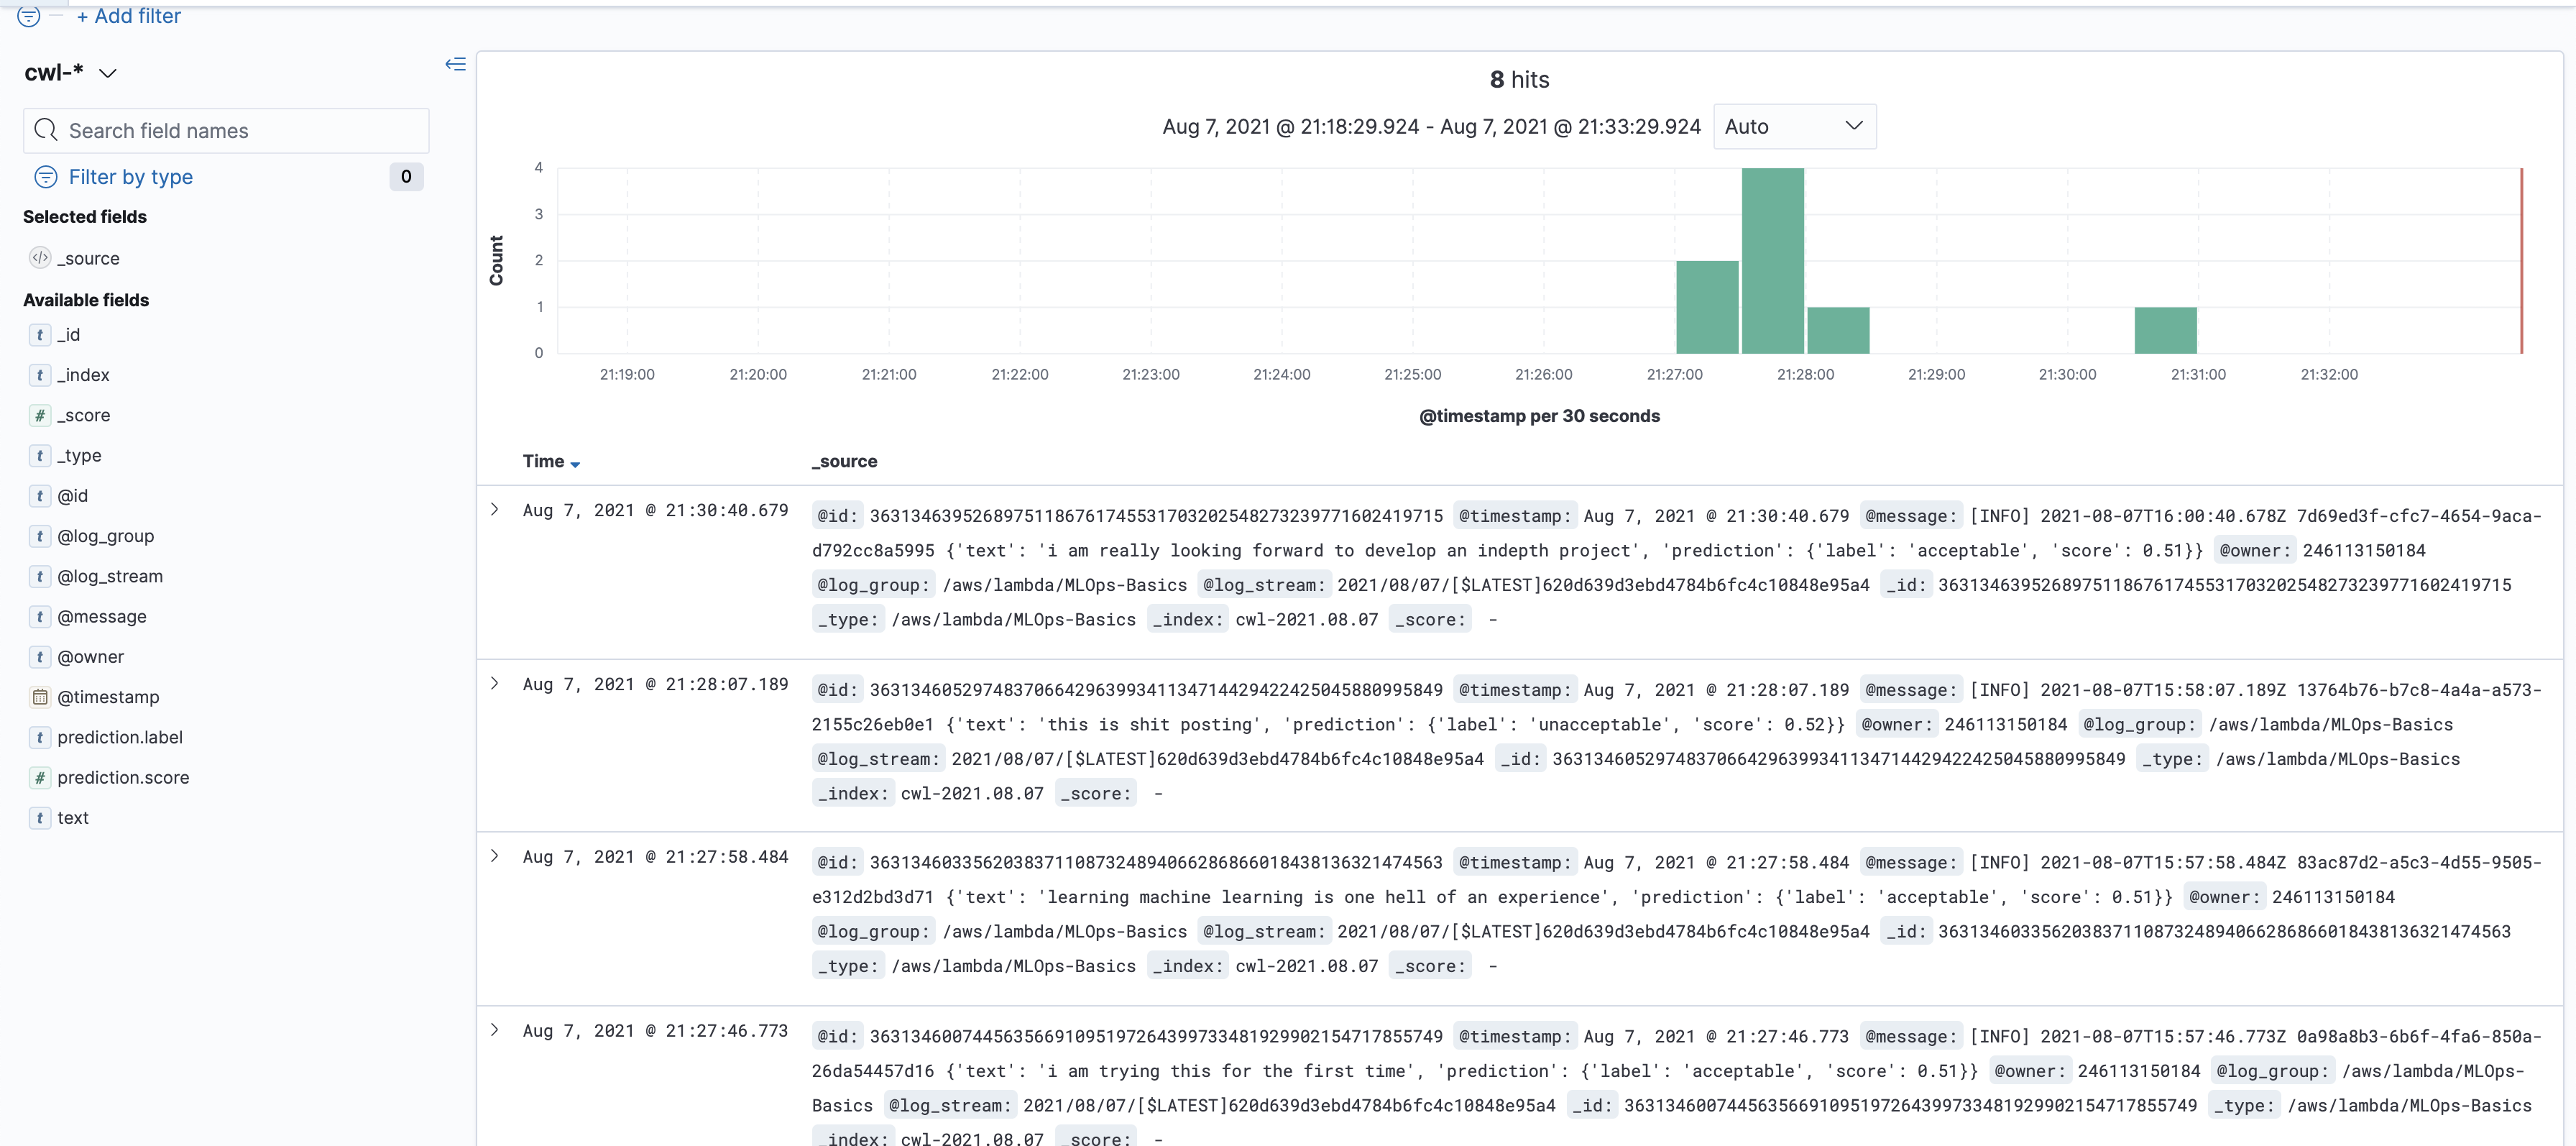
- Once the pattern is created, the logs will be visible in
Discover

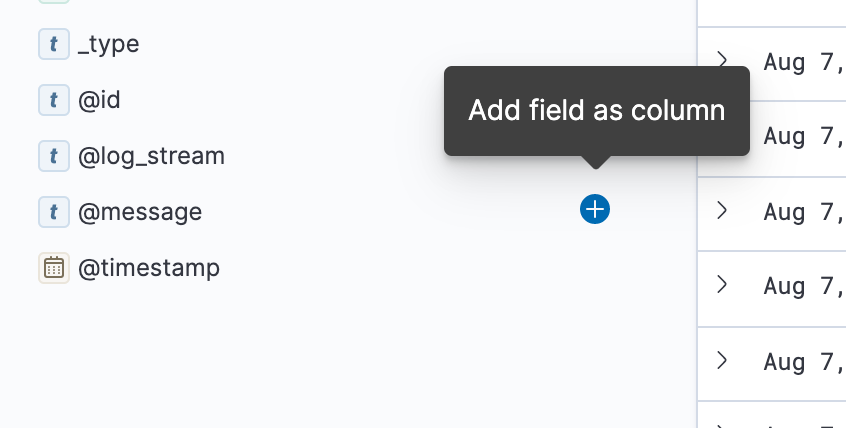
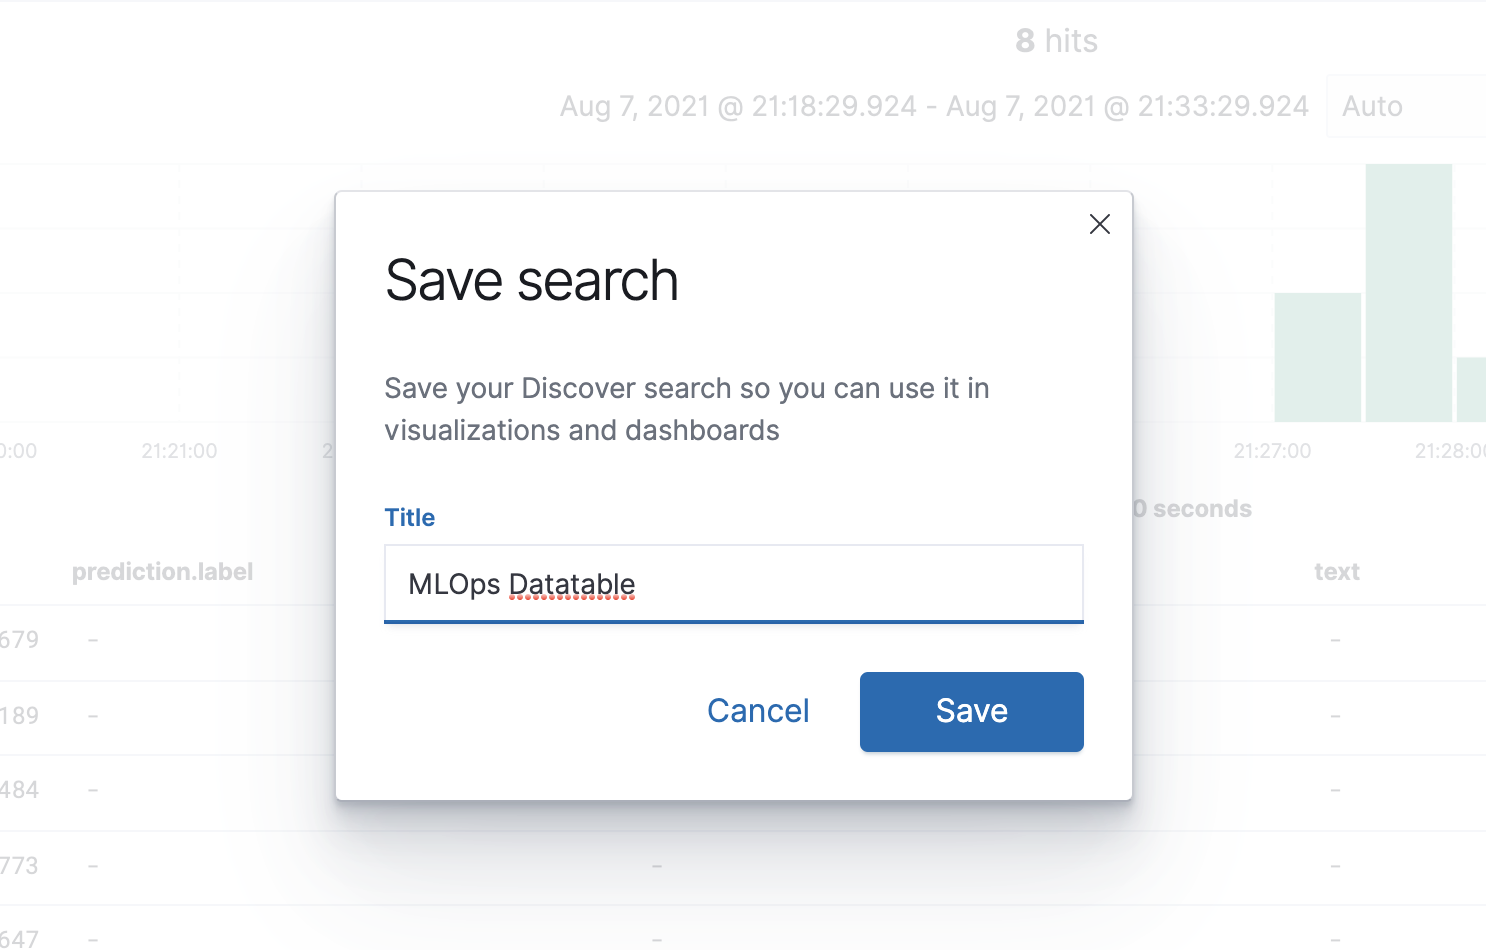
- Create a data table by selecting the relevant fields. I have selected the fields
prediction.label,prediction.label.keyword,prediction.score,text..

- Save the data table by giving it a name.

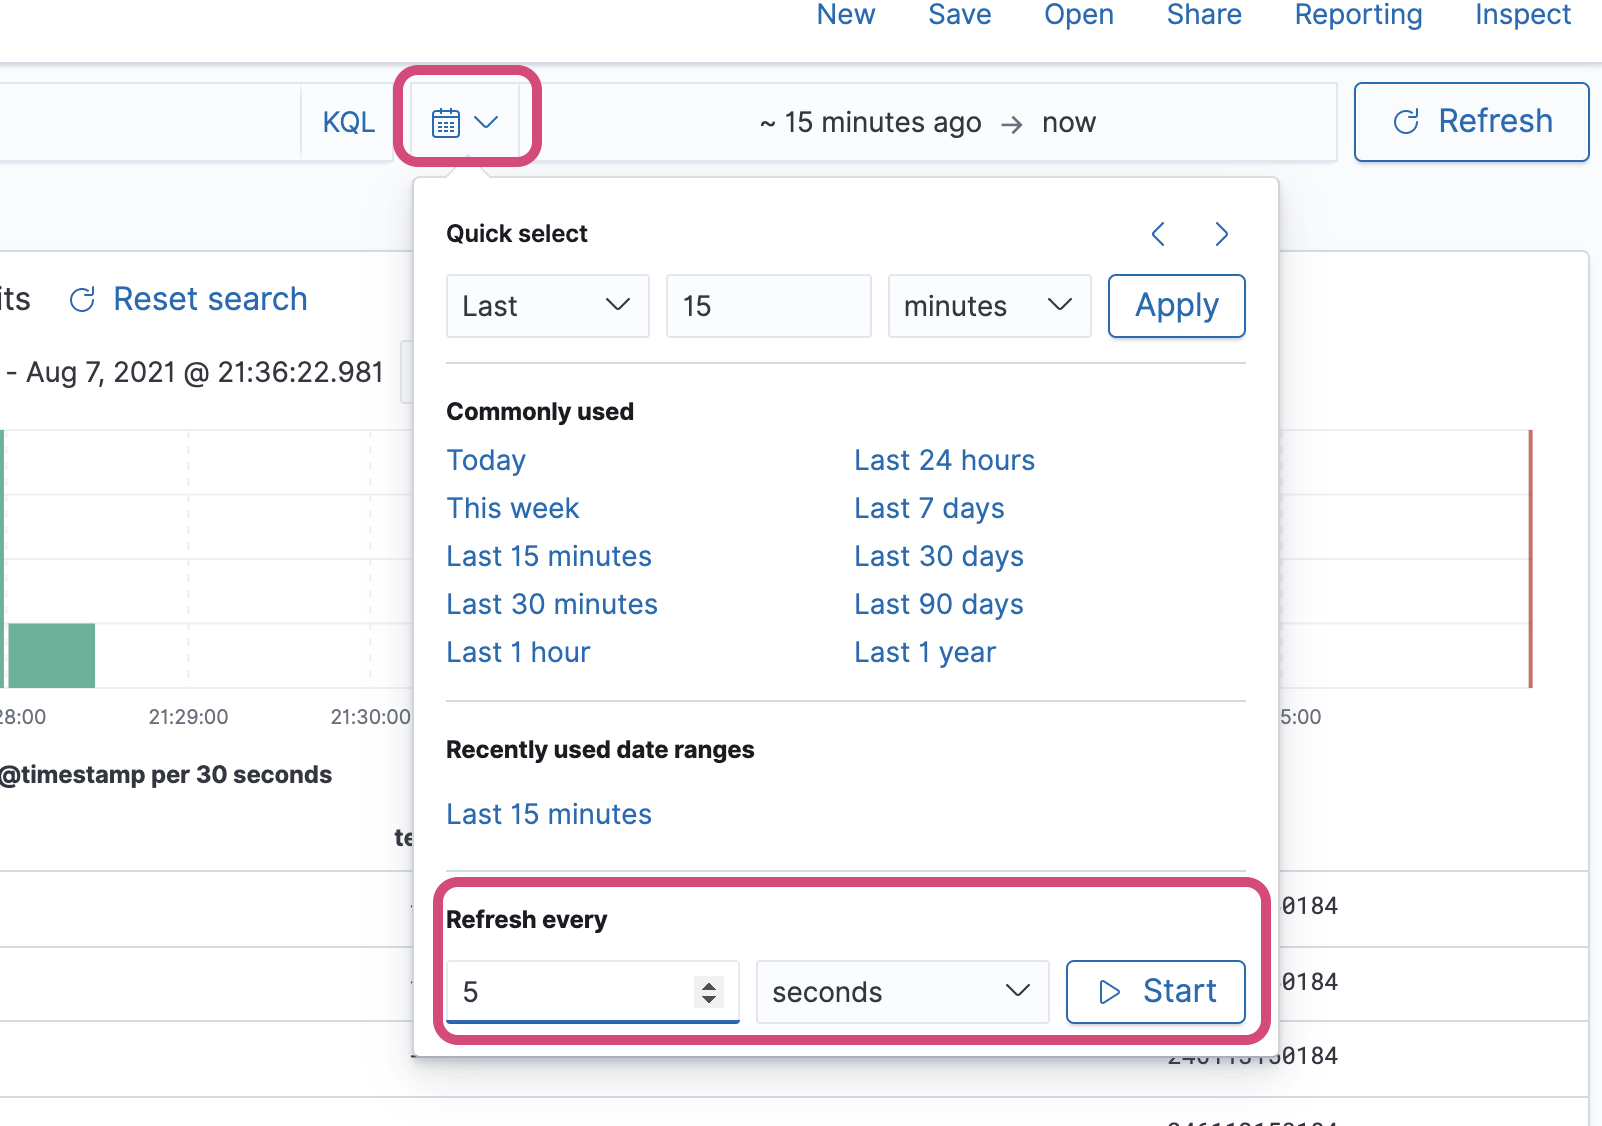
- Adjust the refresh time to 5 secs so that the latest logs will be fetched. Click on
Start.

Creating Kibana Visualisations
Let's create some visualisations.
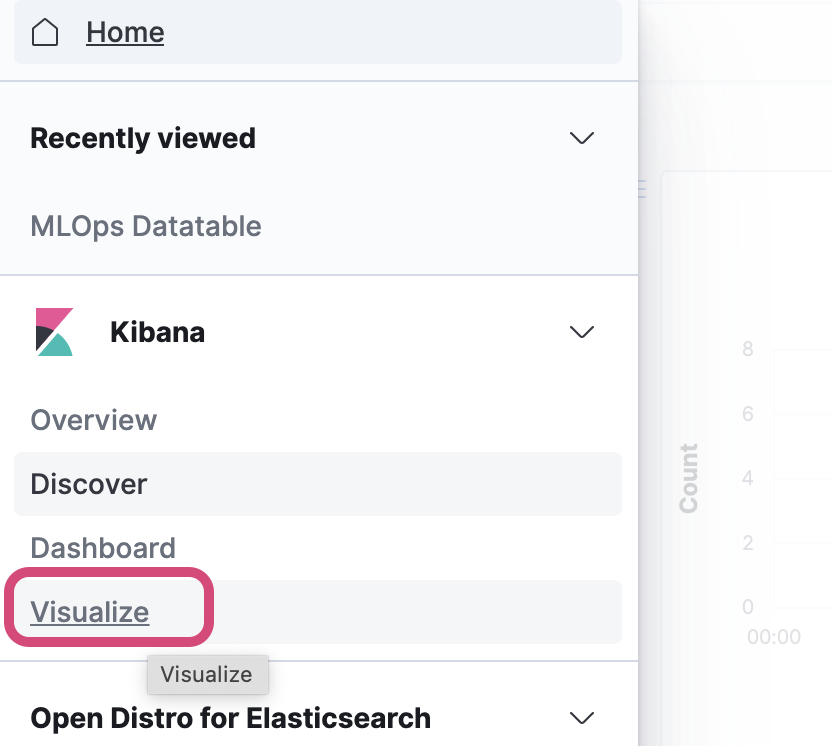
- Go to
Visualizesection in the Kibana.

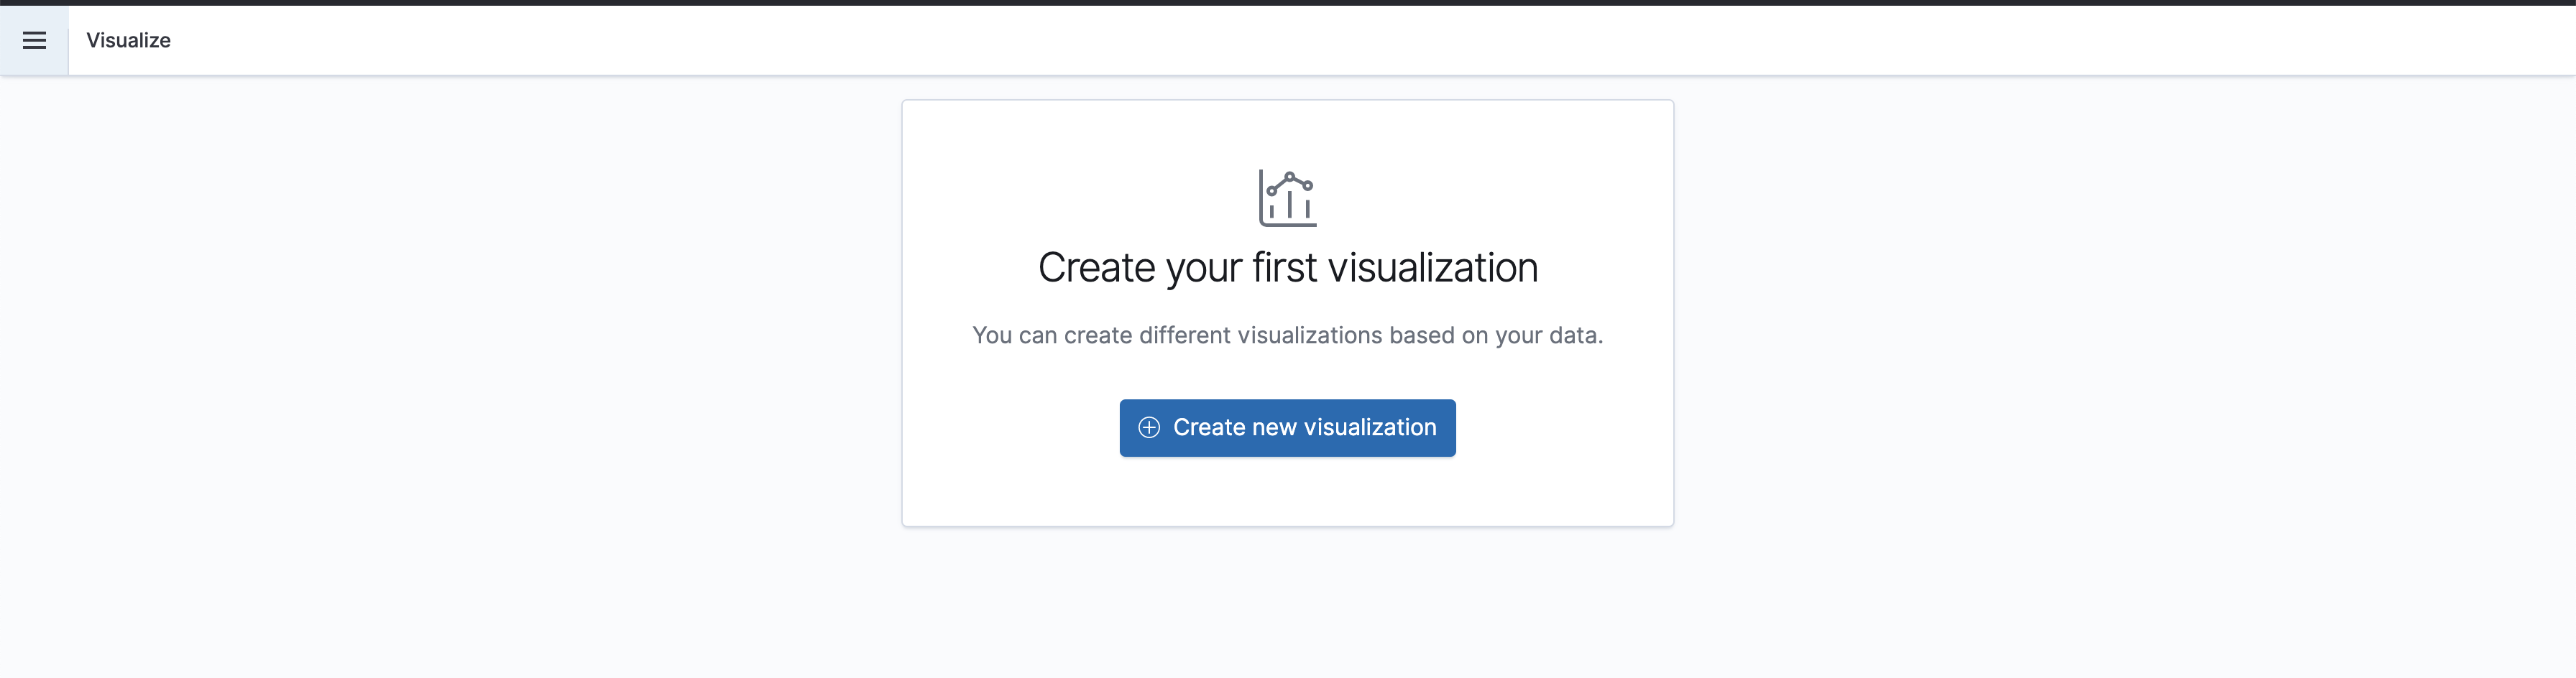
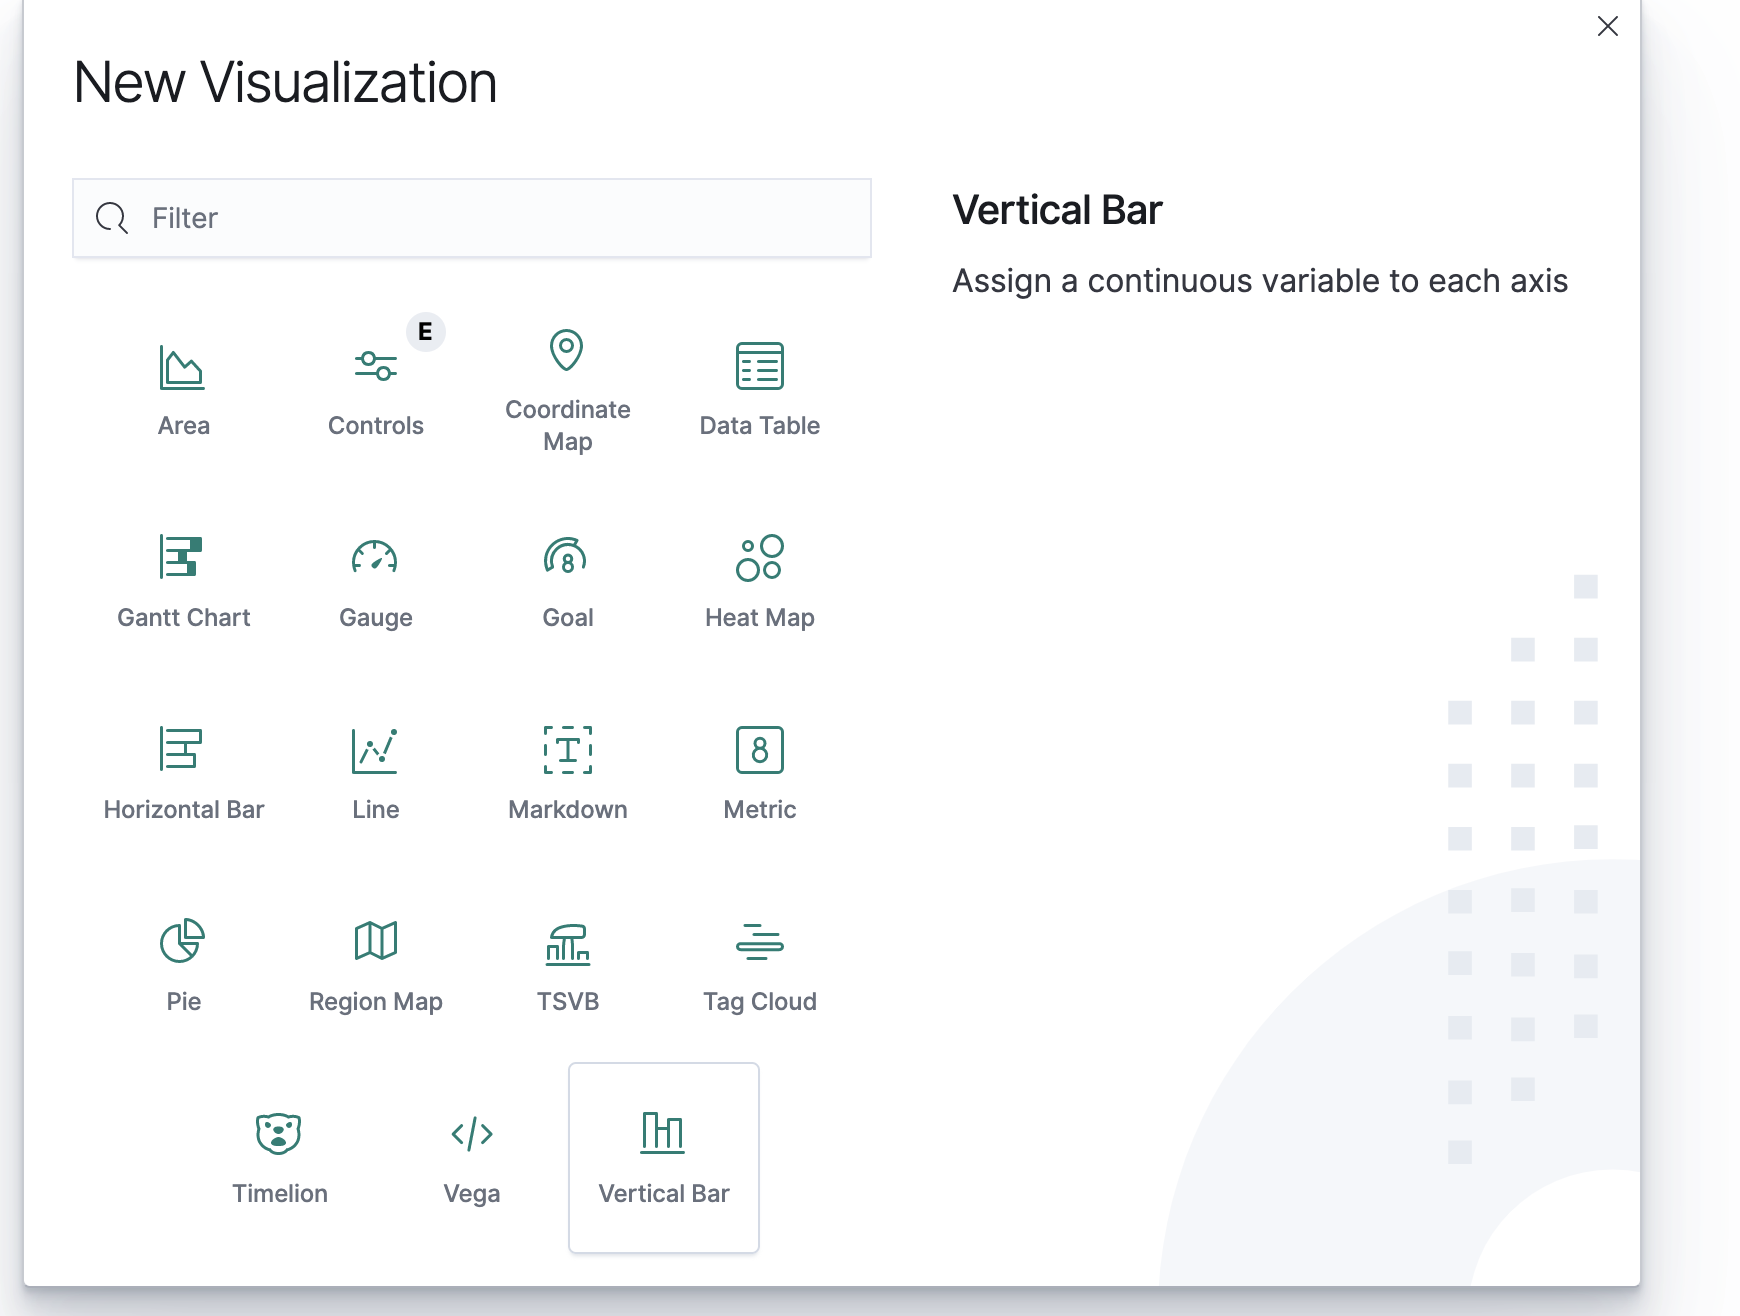
- Click on
Create new Visualization

- Select
Vertical Bar(bar chart) as the type of visualization.

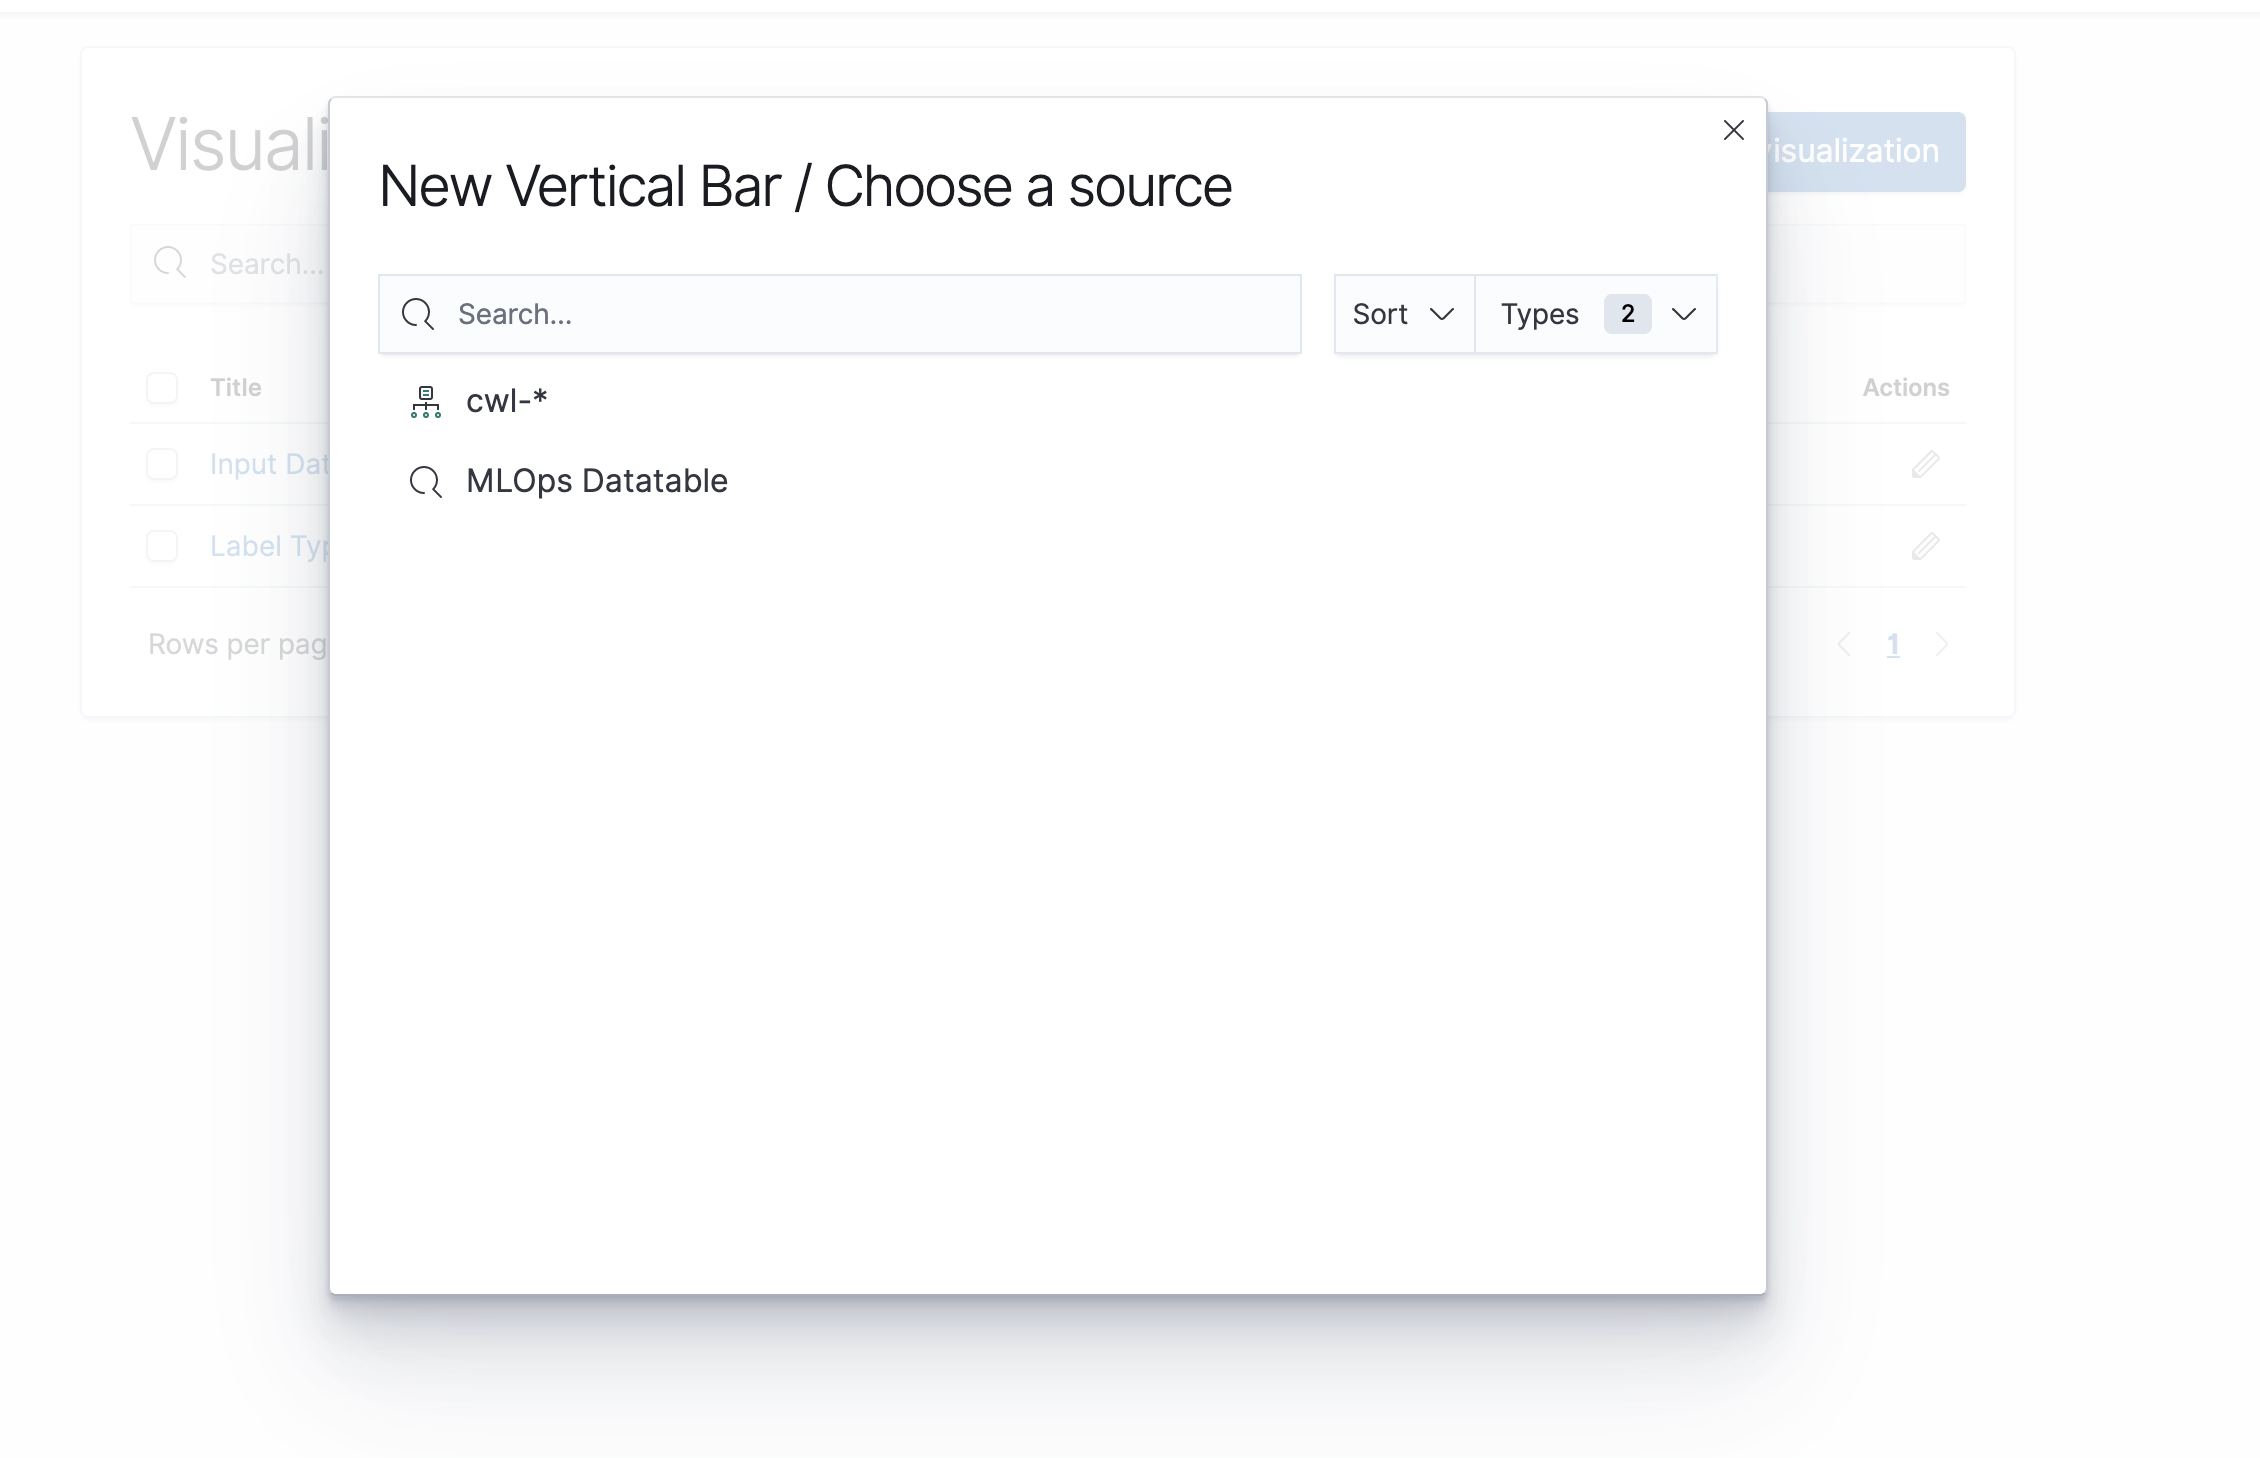
- Select the input for visualisation as
MLOps Datatable

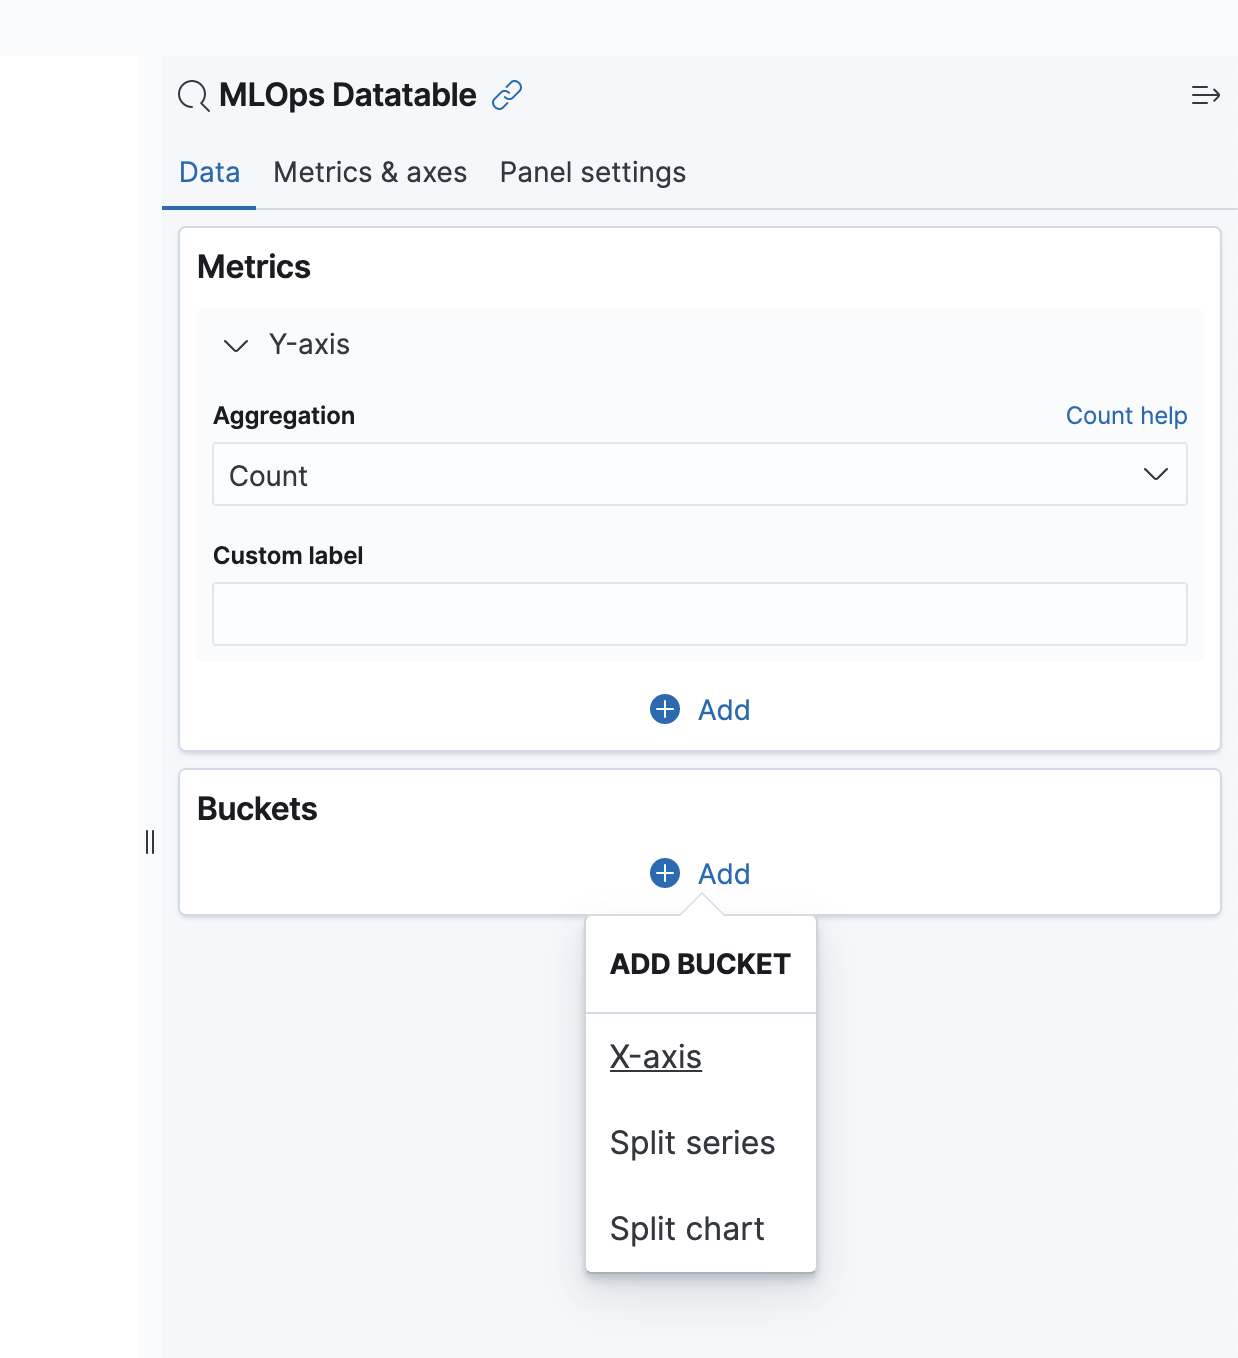
- By default only Y-Axis is created with aggregation as Count. Let's create X-Axis.

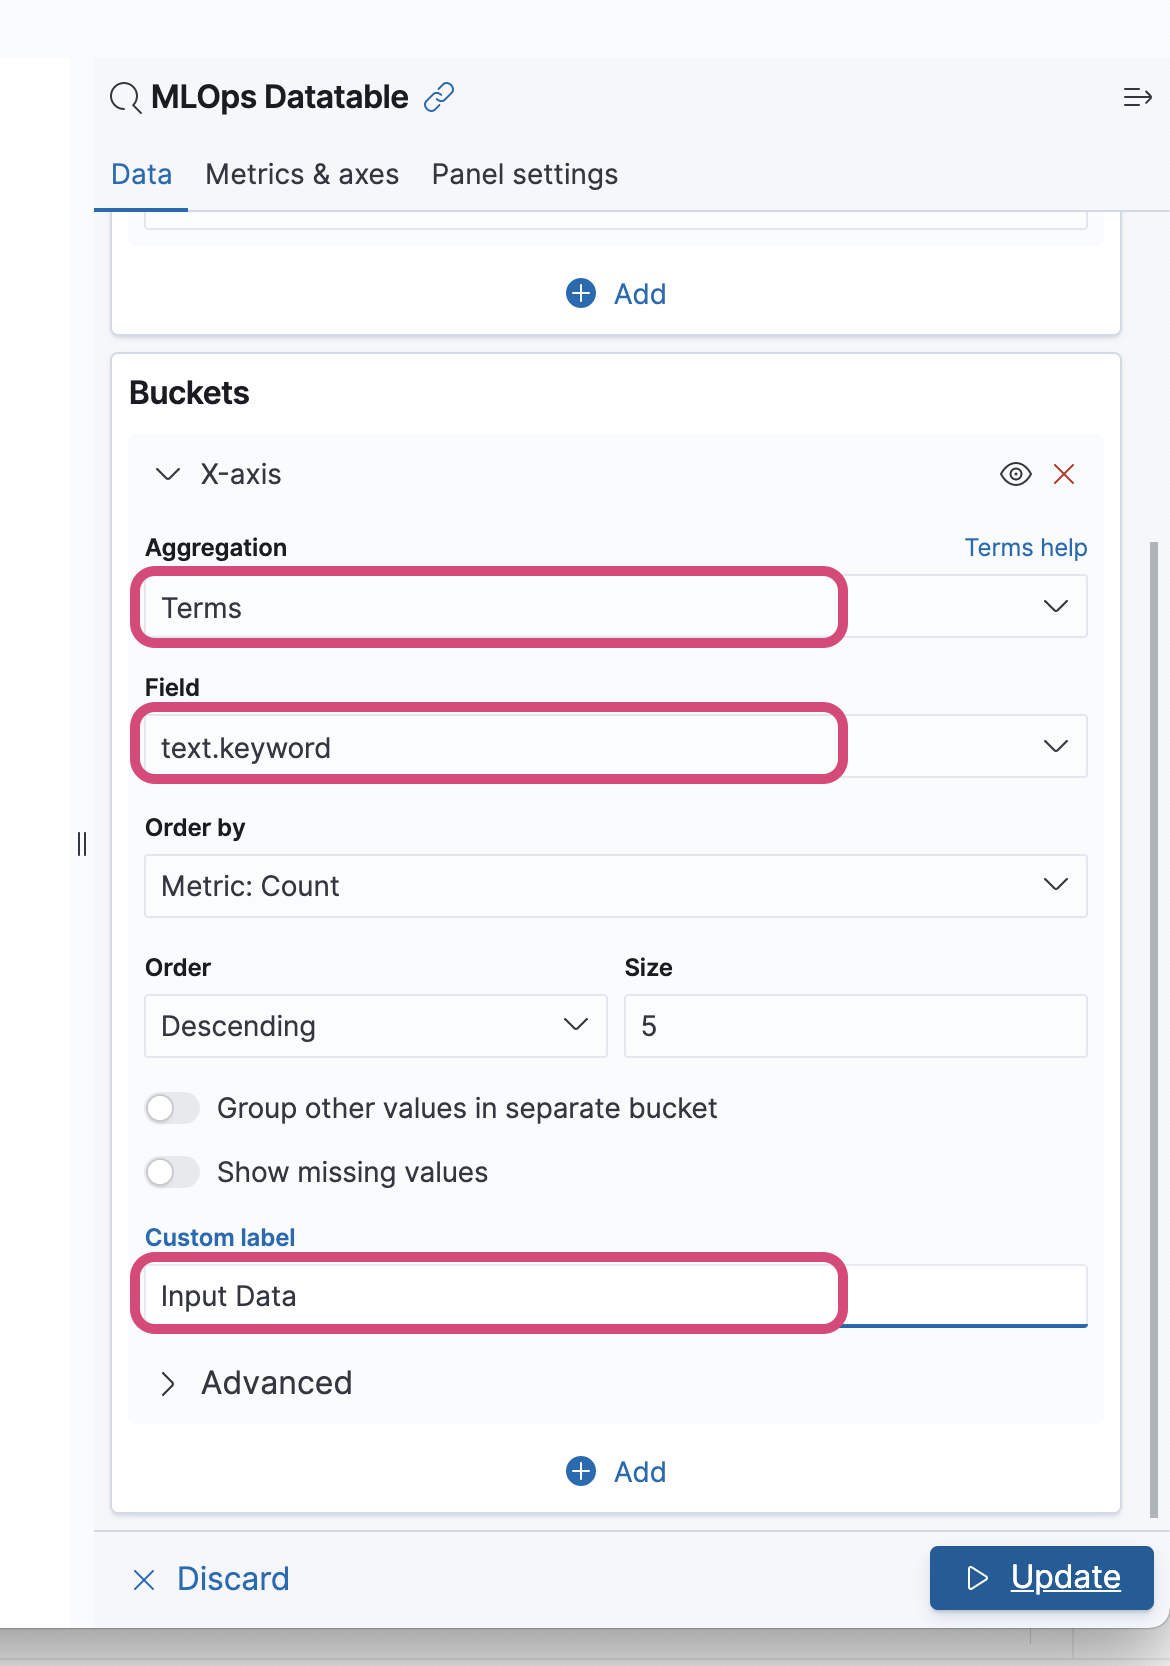
- Select the aggregation type as
Termsand select the required field. Any custom label can also be provided.

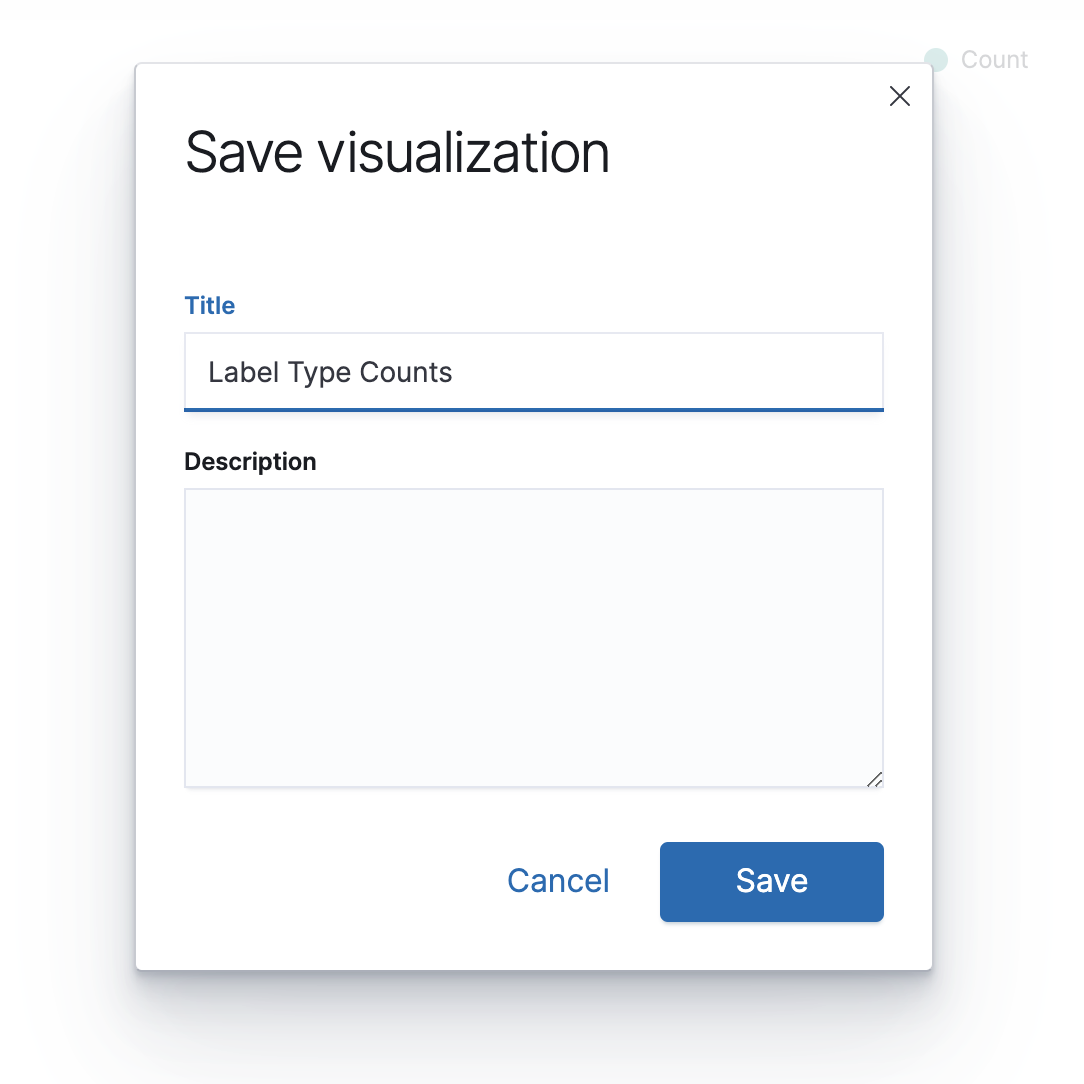
- Save the visualisation by giving it a title.

Creating Kibana Dashboard
Dashboards can be created with the necessary visualisations.
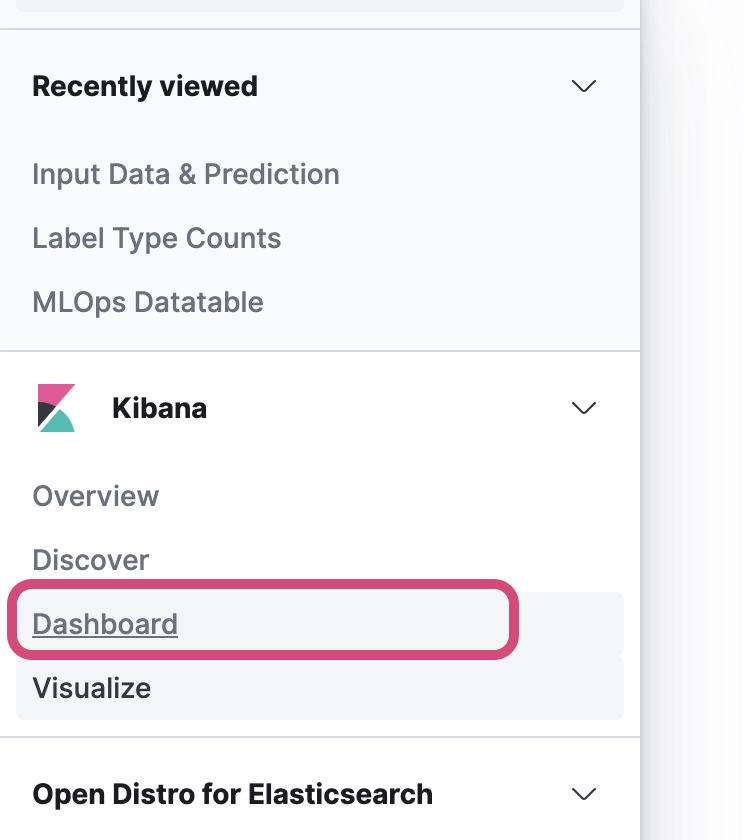
- Go to the
Dashboardsection in the Kibana

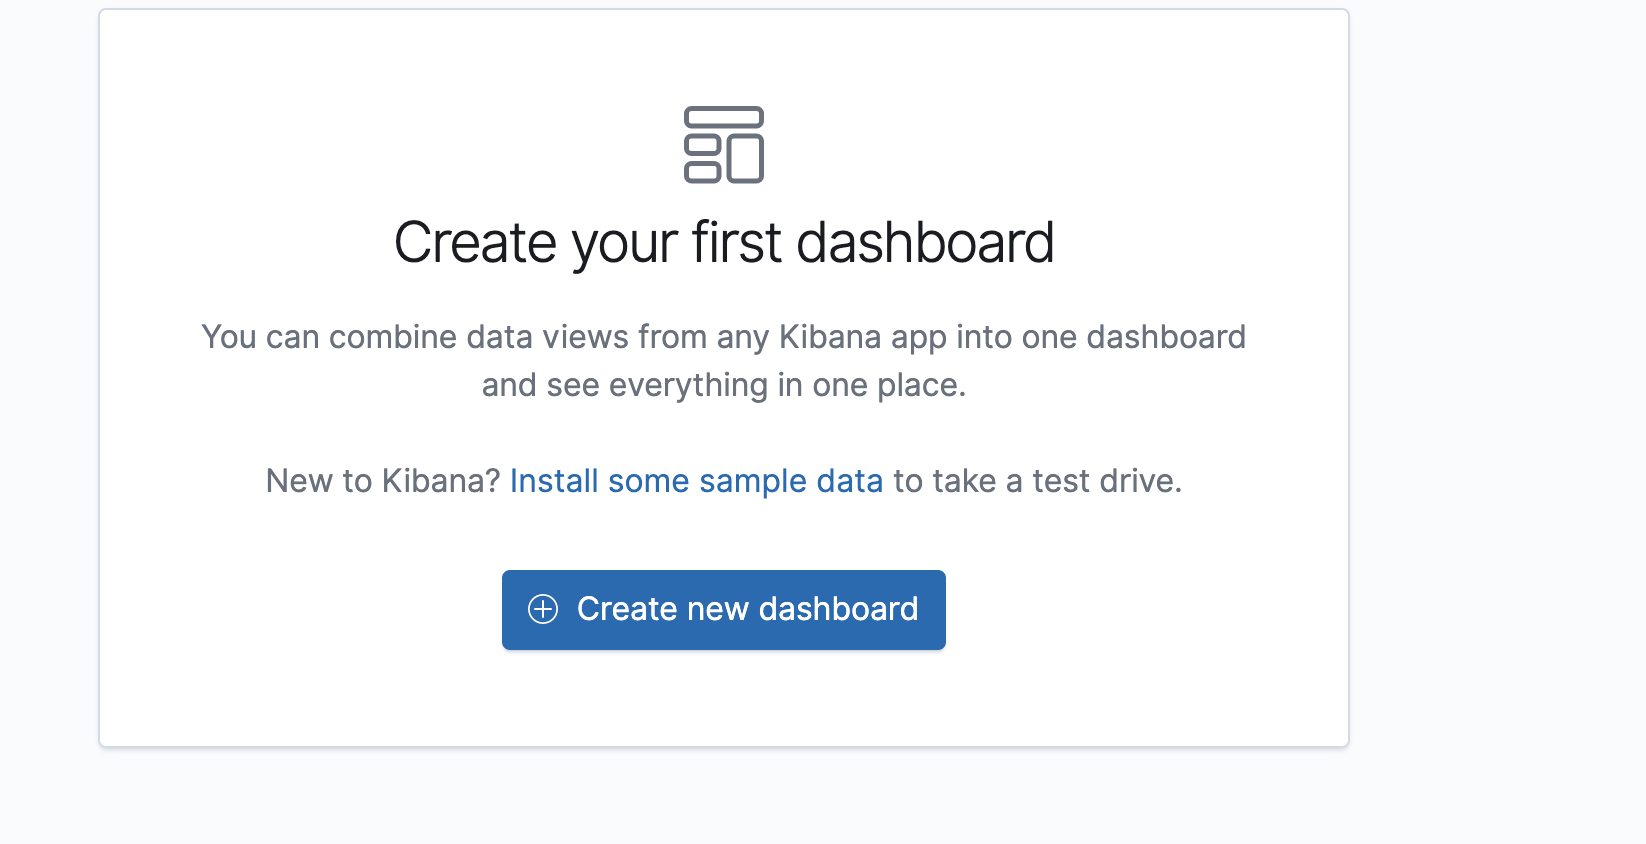
- Create new dashboard

- Click on
Addbutton. This will open up a pane on the right side containing all the visualisations we have created till now.

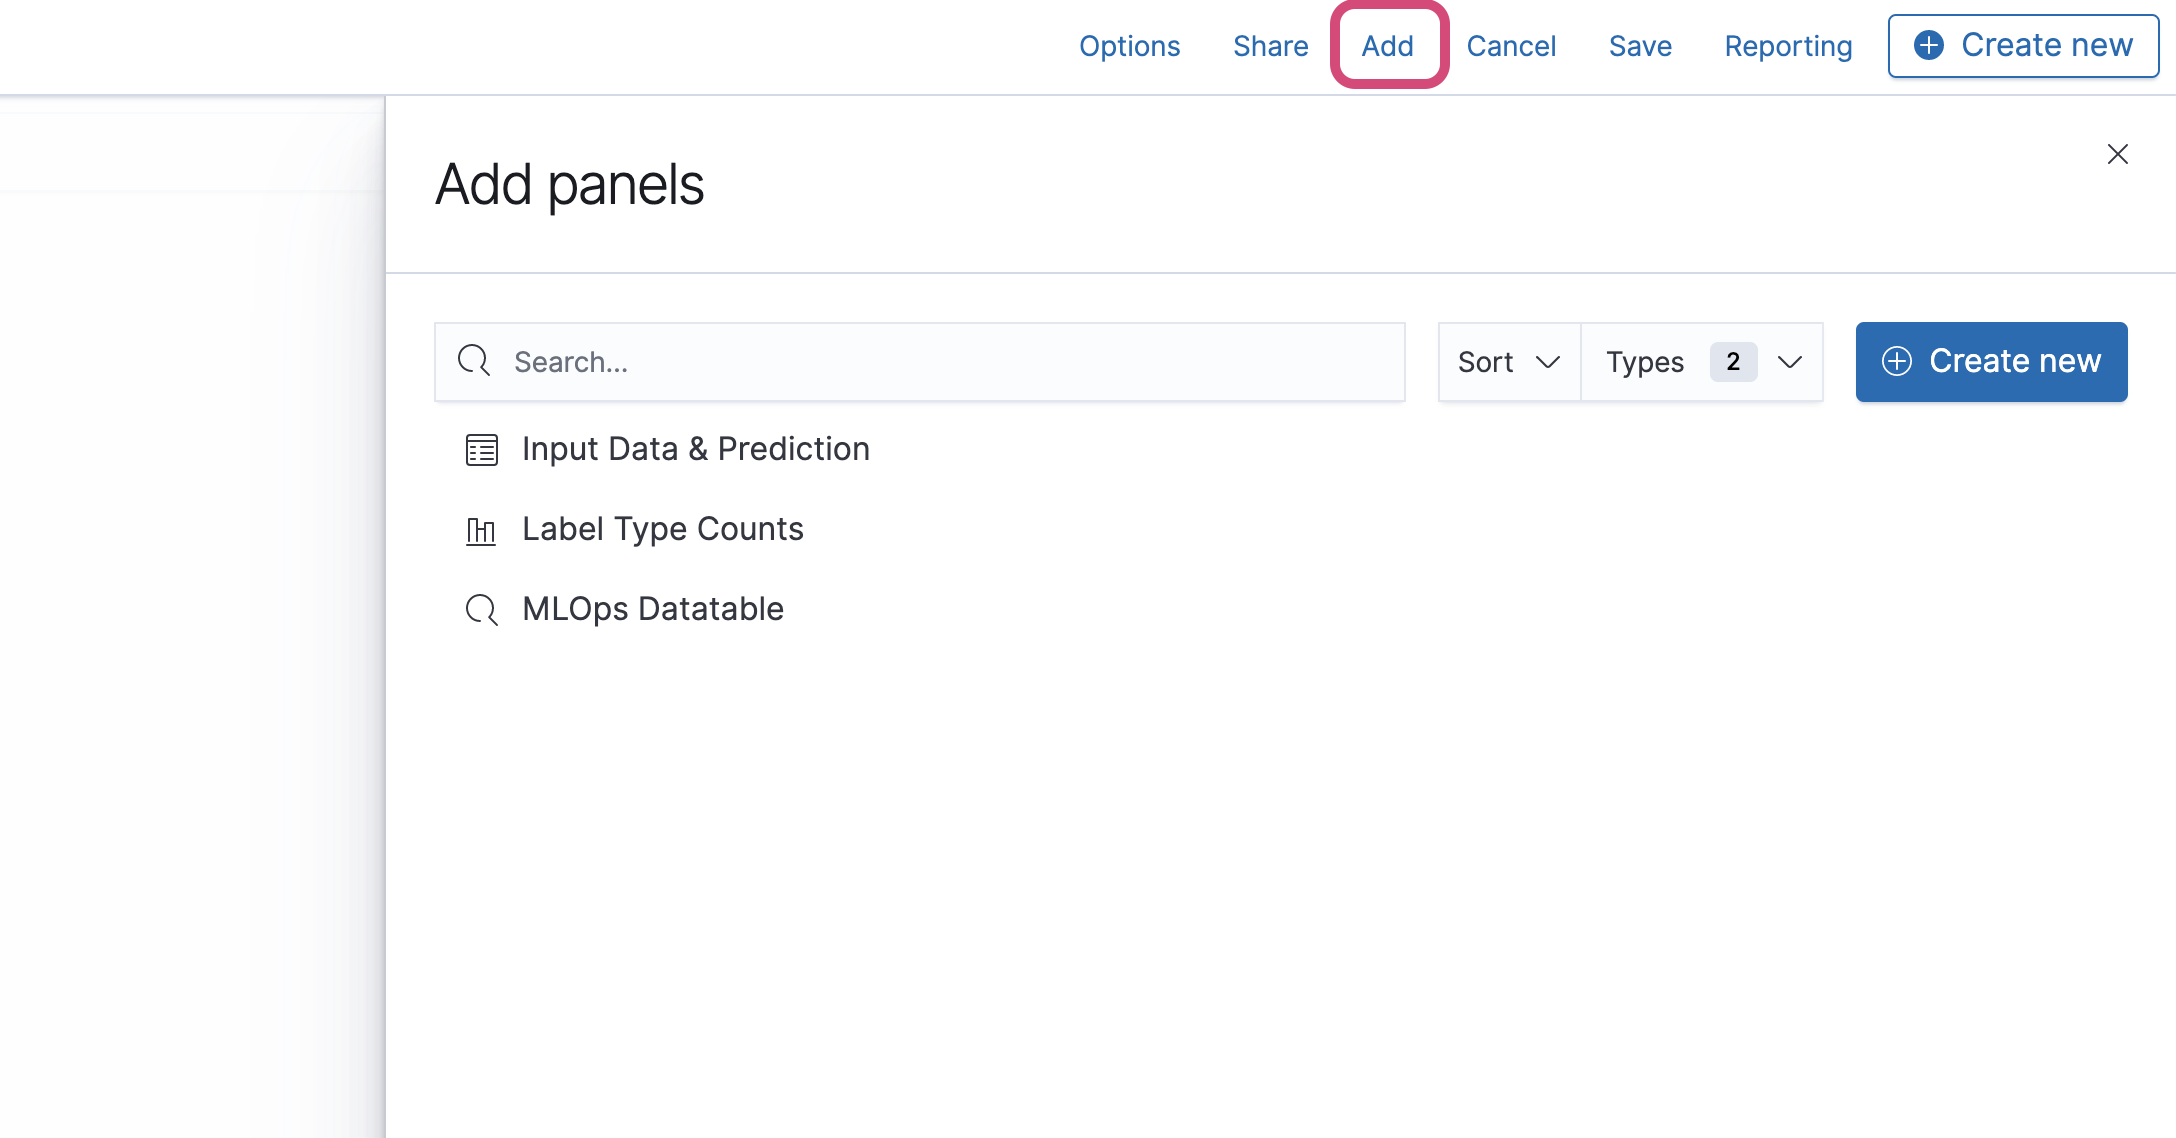
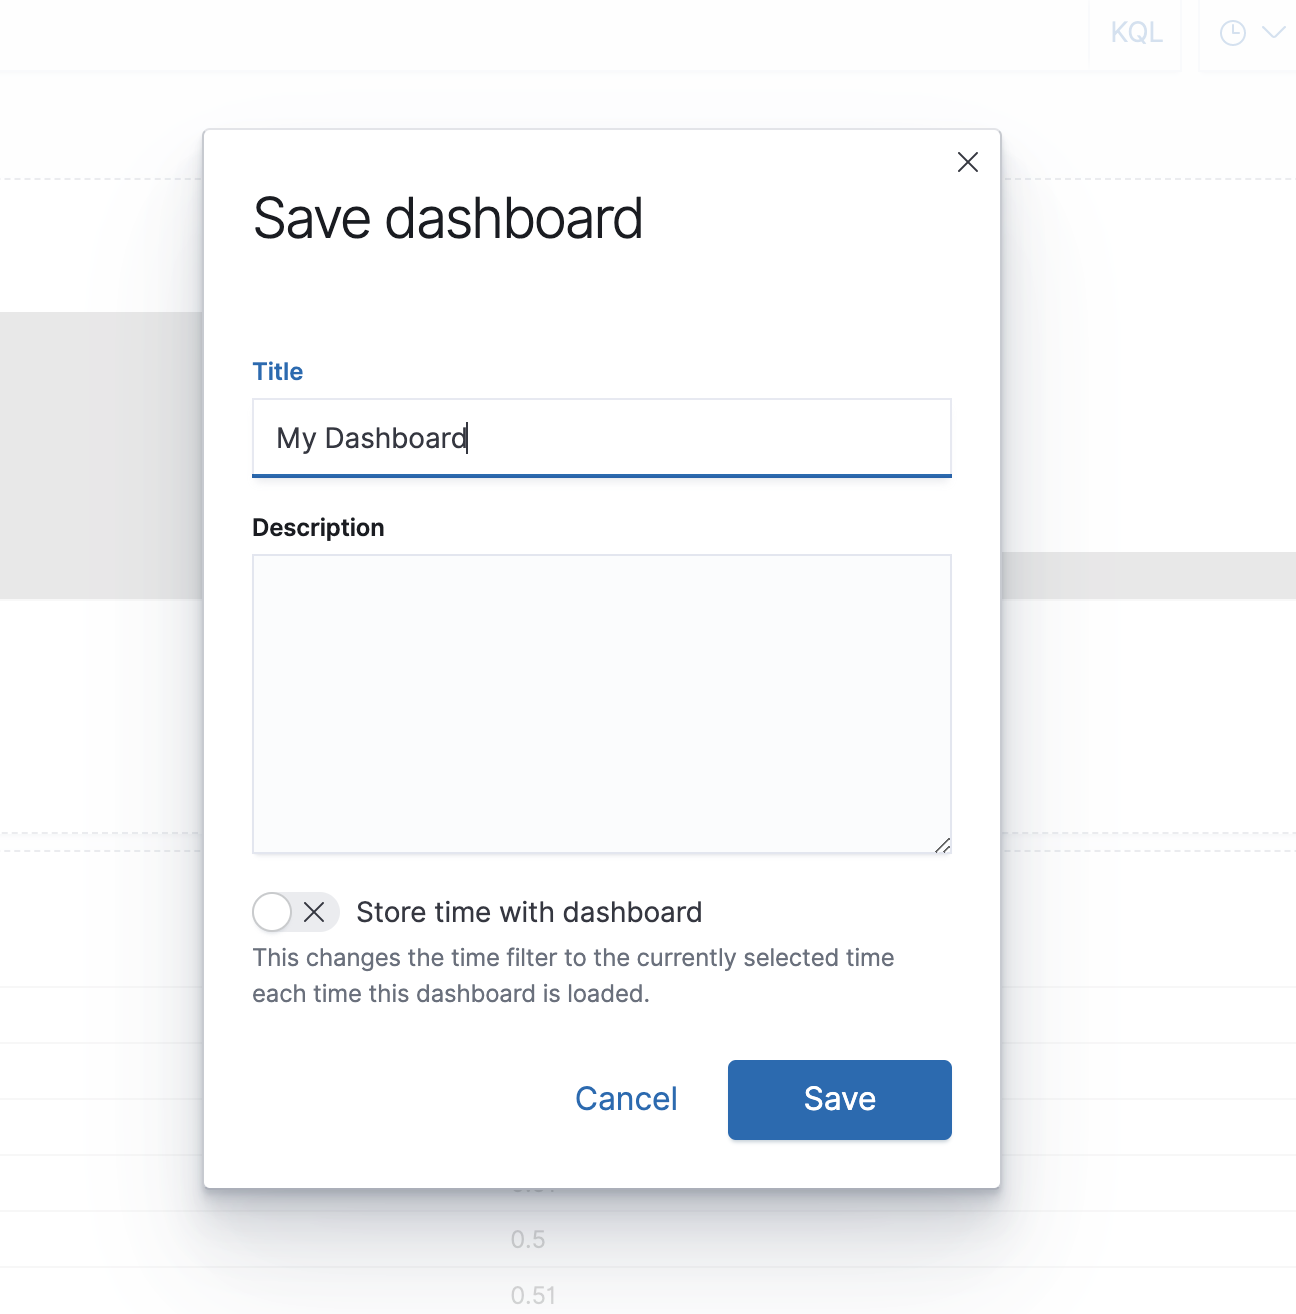
- Select the necessary visualisations and save the dashboard by giving it a name.

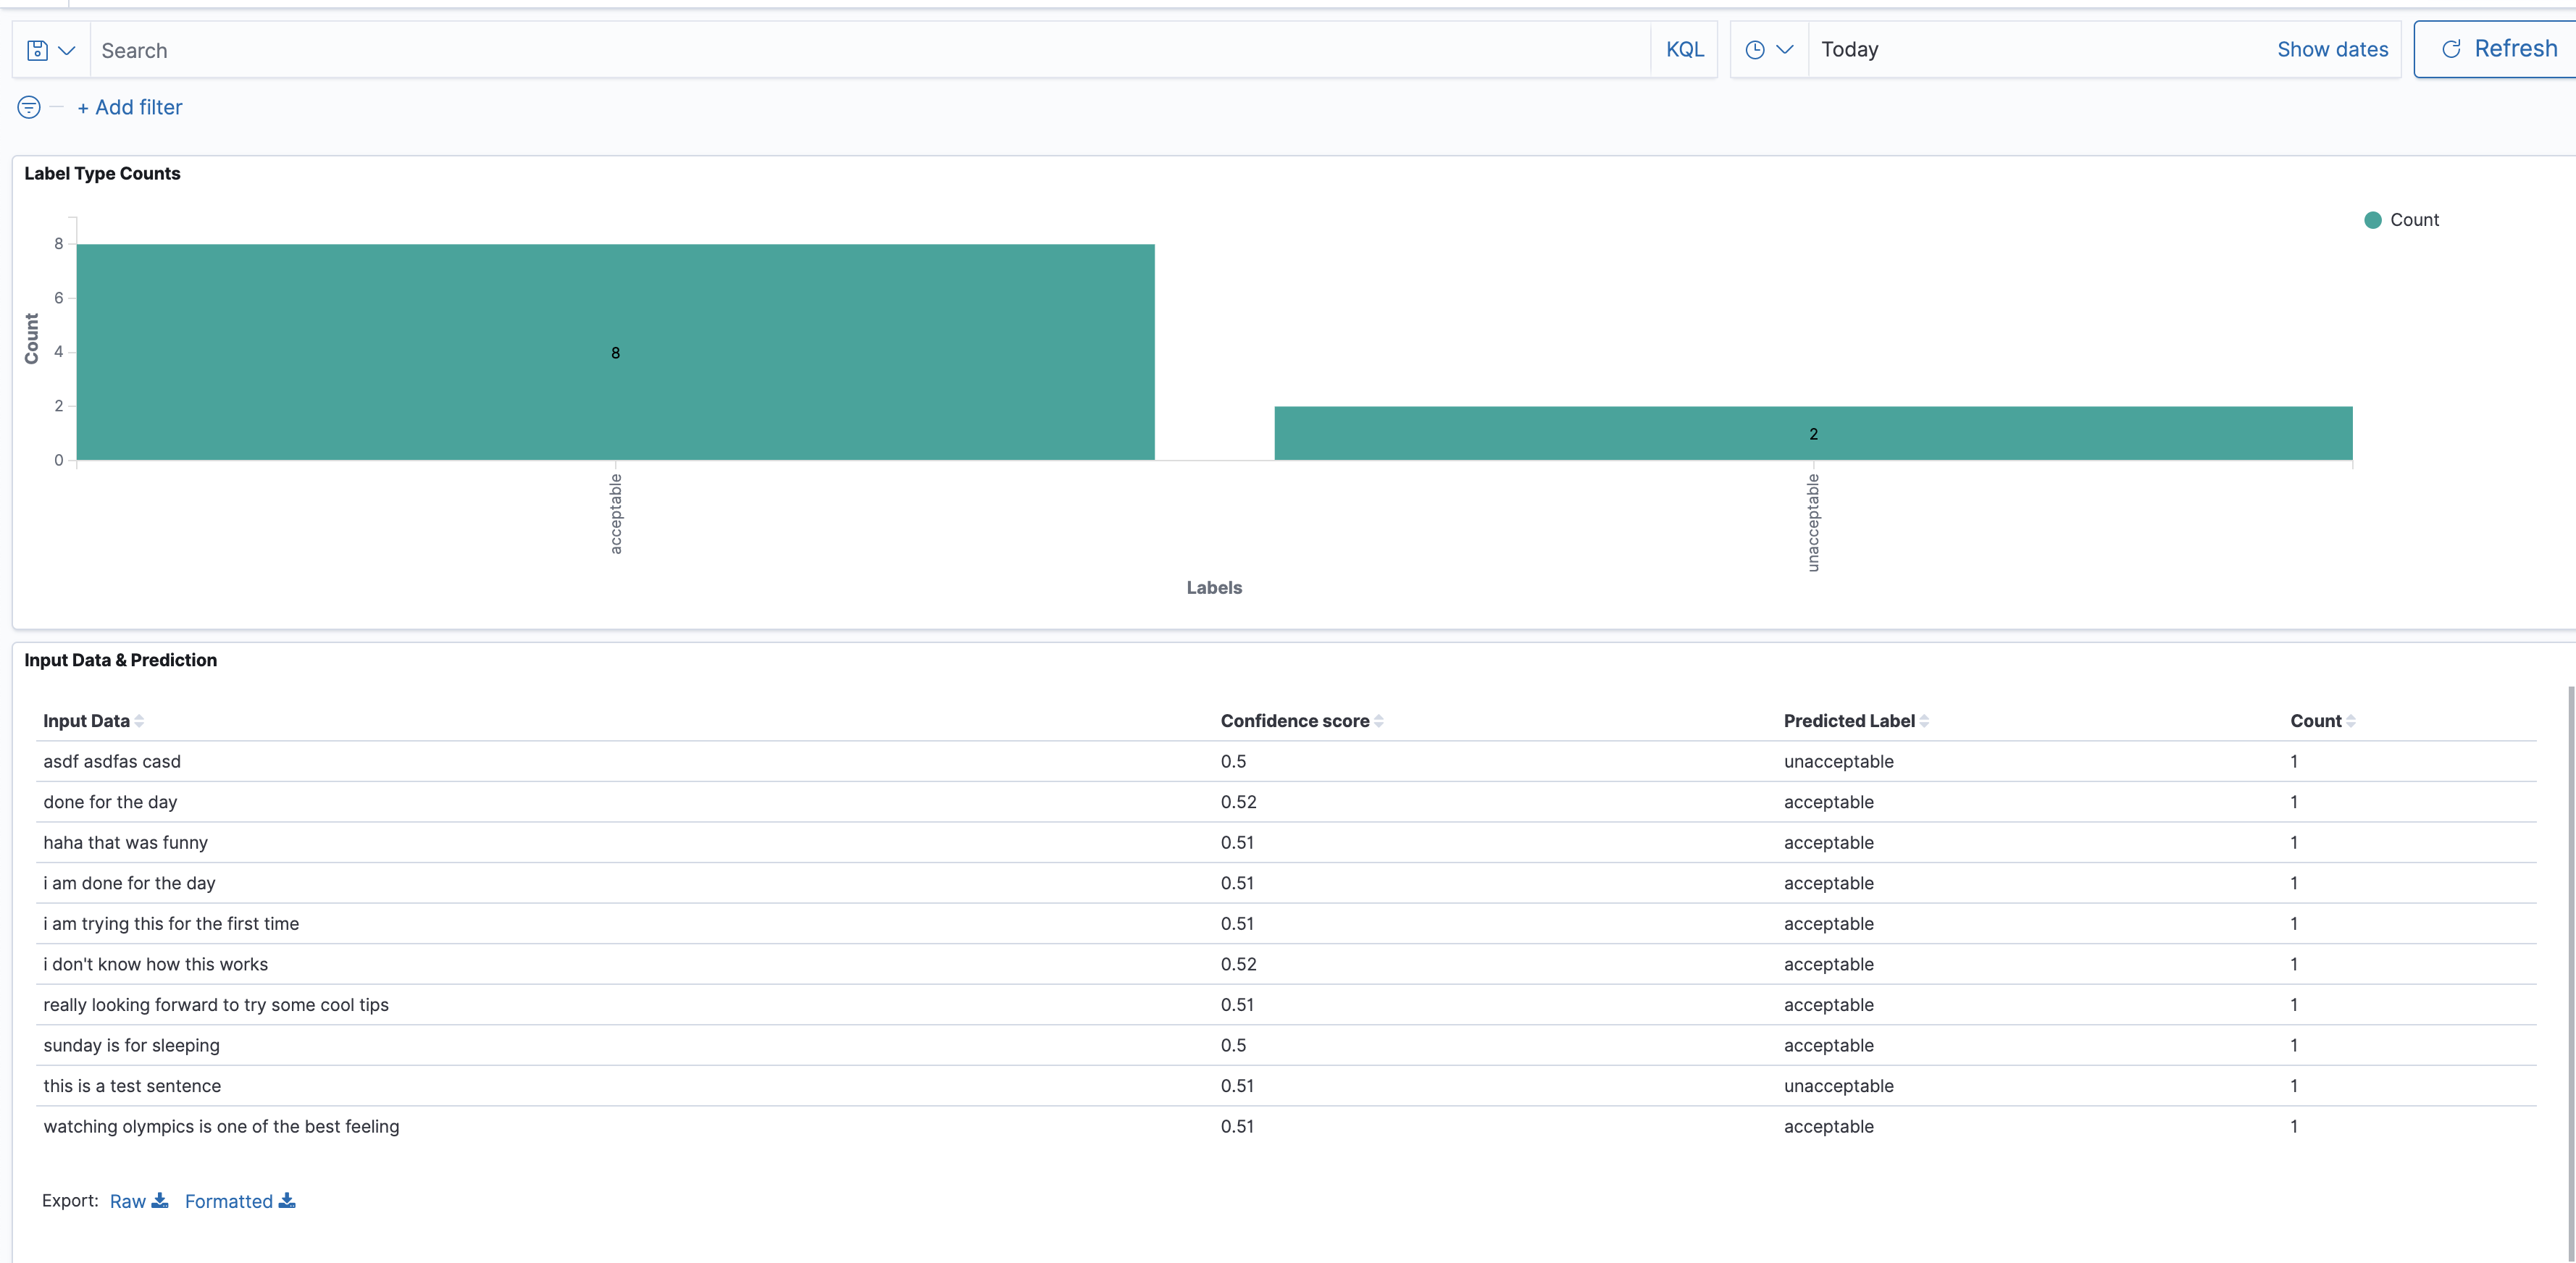
- Now the dashboard contains the visualisations. These visualisations can be arranged according to the needs.

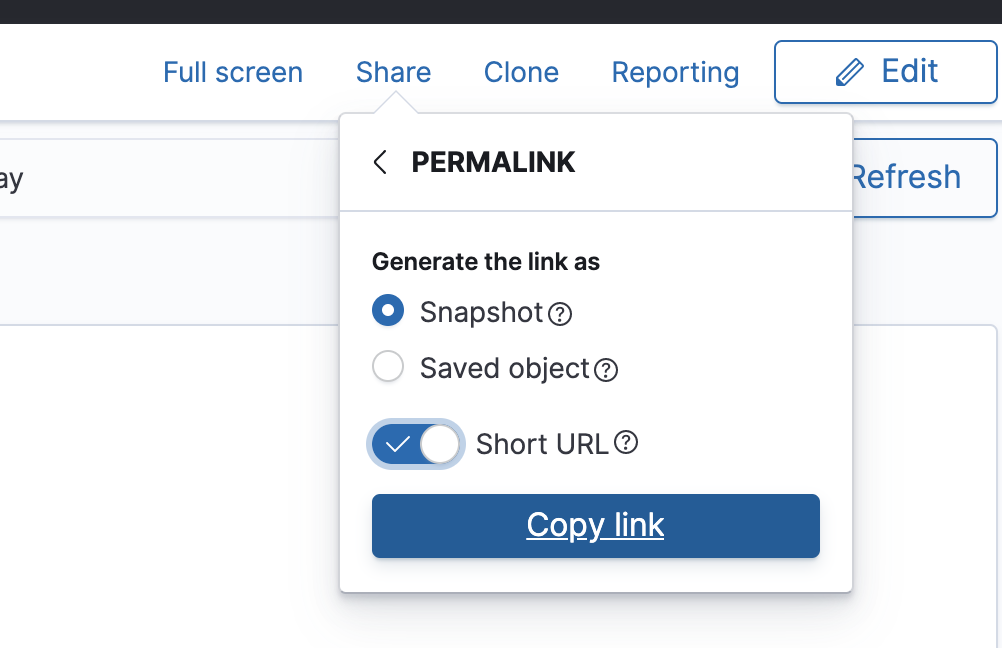
- In order to share this dashboard, click on
sharebutton on top right, andpermalink. Get theShort URLand share it with the concerned people.

🔚
This concludes the post. We have seen how to monitor predictions using Cloudwatch & Kibana.
Complete code can also be found here: Github